How to create a cash flow and profit projection for your new location
Growth is exciting. We can take what’s working and do more of it for increased profit and cash flow. Adding a location is one way to do this. A new location is a major commitment of time and money with the potential to expand our business and increase our profit.
So, we analyze a new market. We make sales projections. We gather info on potential costs. It’s now time to put all this together to see if we should open a new location. In this article, I’ll walk you through how to build cash flow and profit projections for the new location.
I don’t know the info for your specific business, so we’ll be looking at an analysis for a company called Jack’s Beanstalk Beans. You may remember the story of Jack and the Beanstalk. Jack trades the family cow for magic beans These beans grow overnight to a massive beanstalk that reaches into the sky where a giant lives. Jack steals from the giant. Jack then kills the giant when the giant chases after him.
It’s a fairy tale with a questionable moral ending for small children. It’s not every night that you soothe your child to sleep with a tale of theft and manslaughter. In some versions of the story, Jack is just stealing back items that the giant stole from Jack’s family in the past. This is much less troubling ethically.
Jack now sells these seeds to farmers, curious travelers, and a criminal element seeing if there’s anything else to steal up there. Jack was selling seeds from one location, and he’s now opening a second location in the north.
Gross Profit
I’ll be walking through a new location workbook examplefrom my Analyzing Whether to Add New Locations course. I’ve used many screenshots from the workbook in this article to show you how the projections are developed.
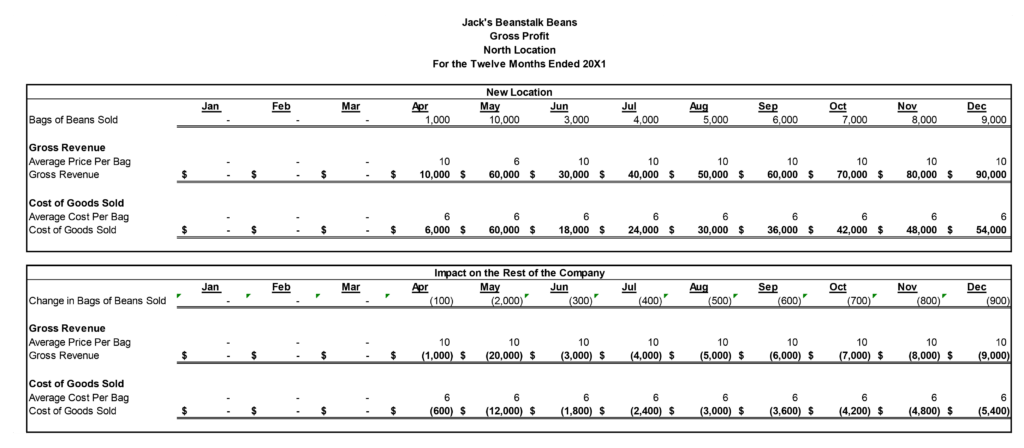
The gross profit worksheet above breaks down the components of gross profit. There are two sections to the gross profit worksheet. The top half has the components of gross profit at the new location. The impact on the gross profit of other locations is on the bottom half.
It’s better to model the new location dollar amounts in one part of the analysis and the impact on the rest of the company in another part. This makes it easier to model the assumptions and then see the impacts if they aren’t combined by being netted together. The profit worksheet can also then be used as a budget sheet for the new location.
The revenues and costs from this sheet are carried over to the contribution analysis sheet we’ll soon look at. Different versions of key assumptions, like the number of bags and average price per bag, can be quickly changed on this sheet to come up with different gross profit scenarios.
The row titles on the far left of the worksheet are the key assumptions of the analysis. Jack’s unit of sale is a bag of beans. Gross revenue is the average price of a bag of beans times the number of beans sold. Cost of goods sold is the average cost per bag times the number of bags sold.
Let’s start with the top box of the new location:
- The new store doesn’t open until April, so there are no sales until April. The April opening is a “soft opening” where the new location isn’t heavily advertised while the new staff work out the kinks of the new location.
- The grand opening celebration and sales event occurs in May. That’s why the number of bags spikes in May. Notice the average price per bag drops to $6, which is their cost. They are running a deeply discounted promotional sale. We’ll also later see a spike in marketing costs in May.
- Sales drop back down in June and slowly rise during the rest of the year.
Now let’s look at the box that analyzes the impact on the rest of the company:
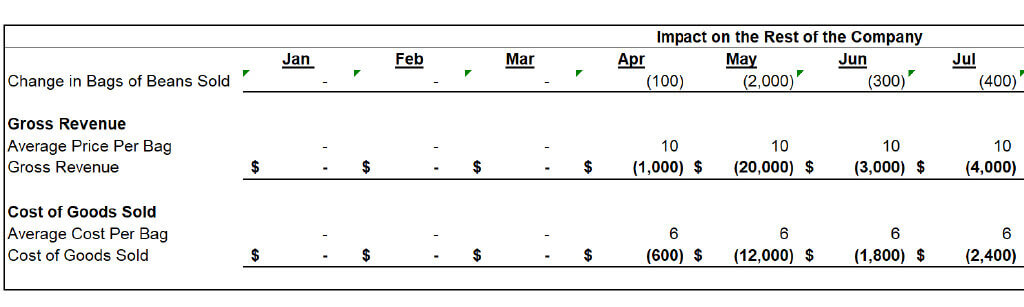
The first row of this box shows that sales at the other locations will go down when the new location opens. This is an example of sales cannibalization. The new store is cannibalizing sales from the existing locations. Jack is estimating that 10% of the sales at the new location are from cannibalization.
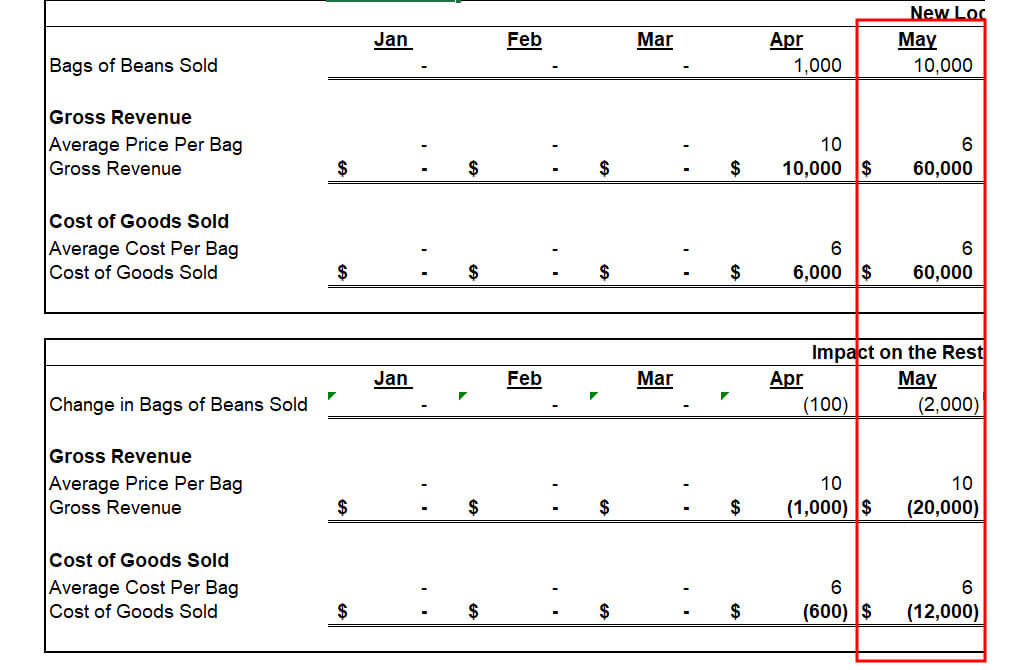
Look at the May change in bags sold. Cannibalization doubles to 20% of the sales at the new store. This is because existing customers are drawn both by the convenience of the new store and by the low price.
The average price per bag in the box on the impact of the rest of the store is always $10. That’s the regular price the existing customers would have paid. In May, many existing customers don’t pay $10 but instead visit the new store to pay only $6. The decrease in sales price for those 2,000 customers is price cannibalization.
Staffing Worksheet
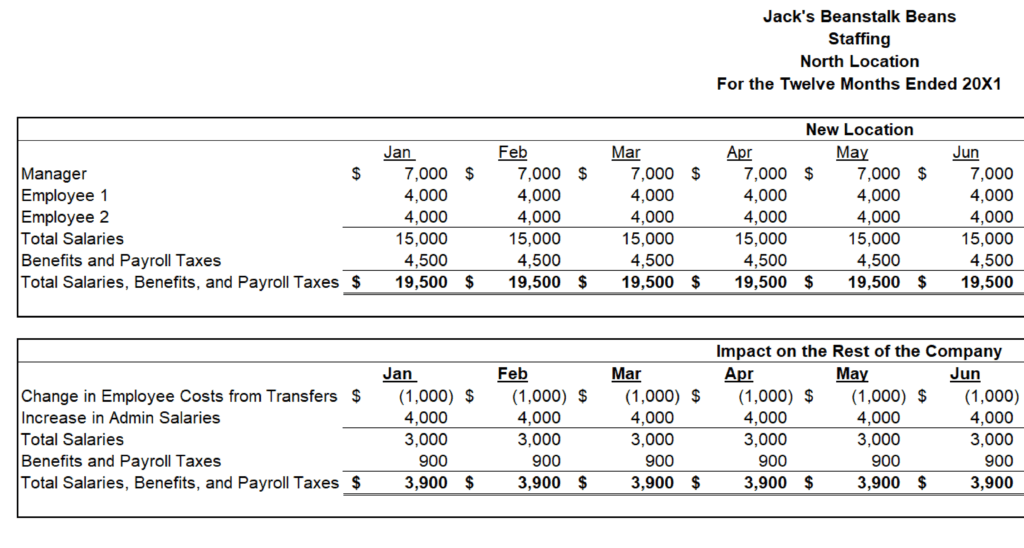
The Staffing worksheet lists the staffing costs of the new locations and changes to staffing costs in other parts of the company. Once again, let’s start with the box that analyzes the new location.
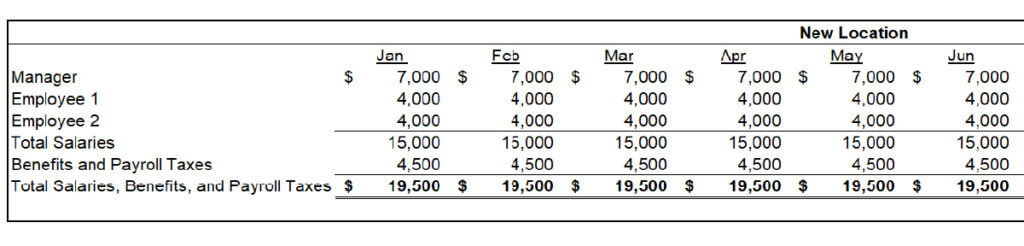
The new location is very leanly staffed with a manager and two employees. The store doesn’t open until April, but the employees start in January. This is an example of costs that start well before the revenue of the store. This analysis assumes that benefits and payroll taxes are 30% of salaries. For analyses like this, it’s common to project benefits and taxes at the same ratio to gross salaries as your existing locations. The total of salaries, benefits, and payroll taxes will be carried over to the profit worksheet.
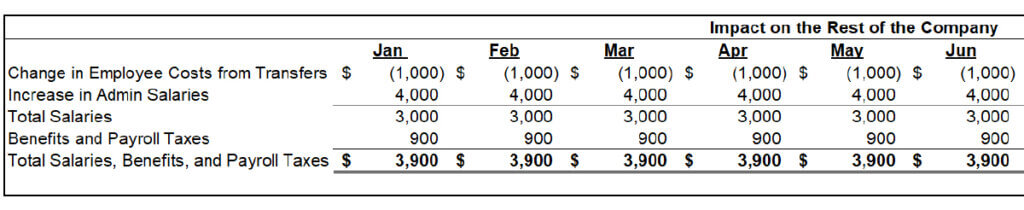
The second box looks at the staffing cost changes in other parts of the company. The first line is a change in employee costs from transfers. The manager at the new location was promoted from another location. The old location hired a new person that is earning $1,000 less than the new manager’s old salary. The second line reflects the need to hire another administration person to handle the increase in staffing and locations.
Contribution Worksheet
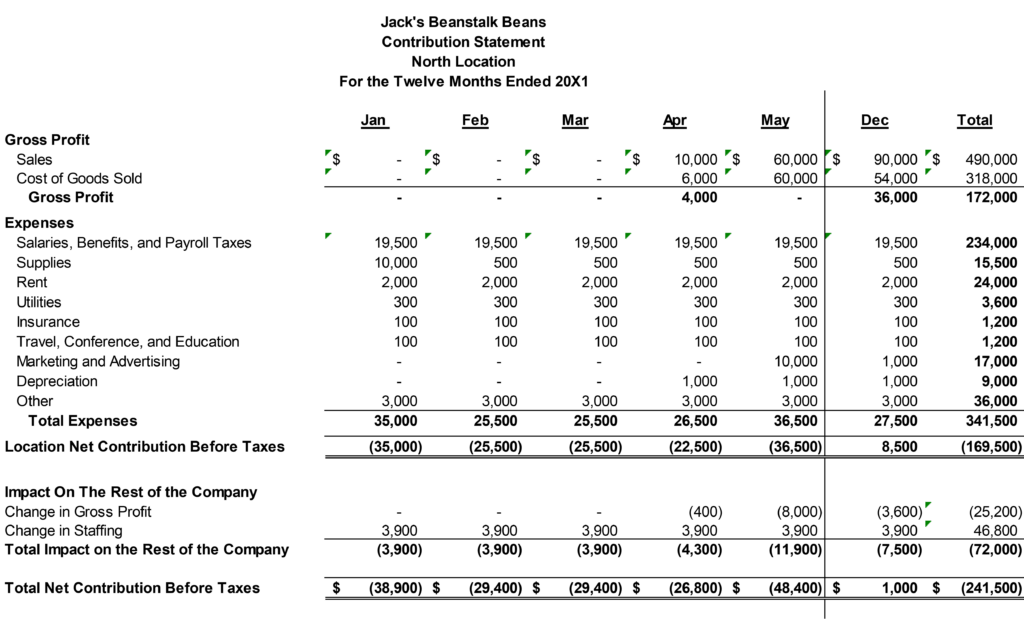
The first thing to note about the contribution worksheet is the title. It’s called a contribution statement. It shows how much profit the new location contributes to the company. If you want to title this as an income statement or profit and loss (P&L), that’s OK too.
I hid the columns for June to November, so the statement fits better on this page. Below is a description of items on the worksheet.
Gross Profit
The first two lines are the sales and cost of goods sold from the gross profit worksheet we looked at earlier
Expenses
Salaries, benefits, and payroll taxes come from the staffing worksheet we looked at earlier.
Supplies are very high in the first month because the new location is stocking up with supplies. It then drops back to a much lower level going forward. This is a simplification. New locations usually have high supply costs for the first few months. They stock up on things over a few months and keep finding out new things they need.
I made very simple assumptions about rent, utilities, insurance, and travel. Jack’s Beans is renting the location rather than buying or building.
You can see the advertising for the grand opening in May. After that, the advertising costs for the new location will likely be higher than other locations but much lower than the grand opening.
Jack only needed to pay for some of the tenant improvements. He also bought some equipment and furniture. He has a very low depreciation expense that starts when the location opens.
It’s a good idea to have an “Other” line to capture expenses you don’t anticipate when planning for the location but seem to crop up every time you open a location.
Location Net Contribution Before Taxes
This gross margin minus the expenses equals the net contribution before taxes for the location. All the parts we’ve seen could be used as a location budget.
I was very intentional when adding “before taxes” to the title of the net contribution totals. Contribution analysis is often done pre-tax. I did it that way for simplicity in this example. It’s very appropriate for non-profits and pass-through entities like LLC or S-Corporations. You may want to model the tax implications at the location level or as an impact on the rest of the company. This might be especially true for projecting cash flow because a new location could provide very large deductions in the early years.
Impact on the rest of the company
I’ve said a few times that I prefer to model the location’s amounts as if I’m building a budget for their location. I then model the other financial impacts on the company below that. Jack’s simple contribution statement has two examples of this, both of which were discussed in earlier worksheets
Existing customers will stop shopping at existing locations and start shopping at new ones. Some will do this permanently, and some will only stop by the new location to take advantage of the grand opening sale.
Putting this cannibalization on one line reminds me that I need to adjust projections for the other locations. I may need to add these adjustments when putting together next year’s annual budget for the new location.
I may need to adjust the sales targets of existing locations due to the new locations. Managers of the existing locations may have incentive compensation or bonuses tied to sales at their locations. Those sales levels may have been made before deciding to open the new location. It would be unfair for Jack to hold them to sales amounts made before the company decided to open the new location. Existing stores may see a decrease in sales due to the new location. That penalizes the incentive compensation of the existing store managers if the sales targets aren’t adjusted.
The new location caused a small decrease in salaries from a staff transfer, and the company had to hire another employee to support growth. These costs are in the staffing line.
The location’s net contribution plus the impact of the company equals the total net contribution before taxes.
Cash Flow Worksheet
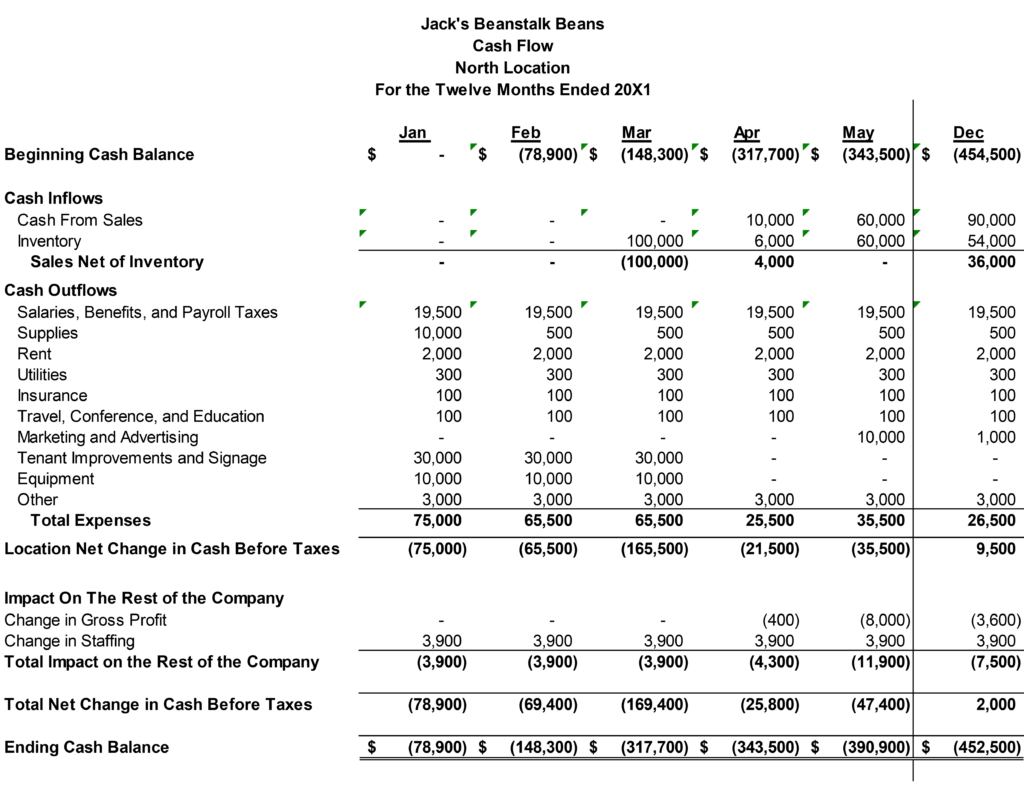
The cash flow worksheet looks very similar to the net contribution statement. One difference is that it starts and ends with the cash balances. Like the contribution statement, I hid the columns for June to November so the statement fits better on this page. You can look at the New Location Analysis workbook to see all the rows. Below is a description of items on the worksheet.
The gross profit section is now titled Cash Inflows. Jack runs a retail outlet and doesn’t sell on credit. His accounting revenue matches his cash from sales. You also won’t see accounts receivable on the balance sheet.
The line that used to say “Cost of Goods Sold” is now titled inventory. It starts with a large $100,000 cash outflow in March to stock the store. From April through December, I used a simple assumption that Jack restocks inventory as it’s sold and that he doesn’t buy inventory on credit. There are no accounts payable on the balance sheet. The cash outflows for expenses are similar to the net contribution statement. The depreciation line on the income statement is replaced with the cash paid for tenant improvements, signage, and equipment. Once again, I assumed Jack used cash on hand for these and did not finance them. There may have been a tenant improvement allowance in the lease that offset some of the total cost of the tenant improvements. There is no debt on the balance sheet.
The impact on the rest of the company is the same as the contribution statement
All this totals to the net change in cash flow. I mentioned earlier that you might want to model the change in cash flow from tax deductions of the new location.
The last line on the worksheet is a running total of the cash balance. Notice that the total cash consumed by the new location is $452,500, which is much higher than the $241,500 net loss on the contribution statement. The $211,000 difference between these two numbers lies on the balance sheet.
Balance Sheet
Cash on the balance sheet ends at negative 380,500. I just pointed out that the new location consumed $452,500 of cash. Why isn’t that the cash balance? This is a balance sheet just for the new location. The remaining negative cash and equity will flow into the balances of the existing locations.
Inventory is $100,000. Tenant improvements and equipment net of depreciation are $111,000. We’ve found the $211,000 of cash outflows in excess of the location loss. It’s invested in the inventory and fixed assets. This shows why growth consumes cash.
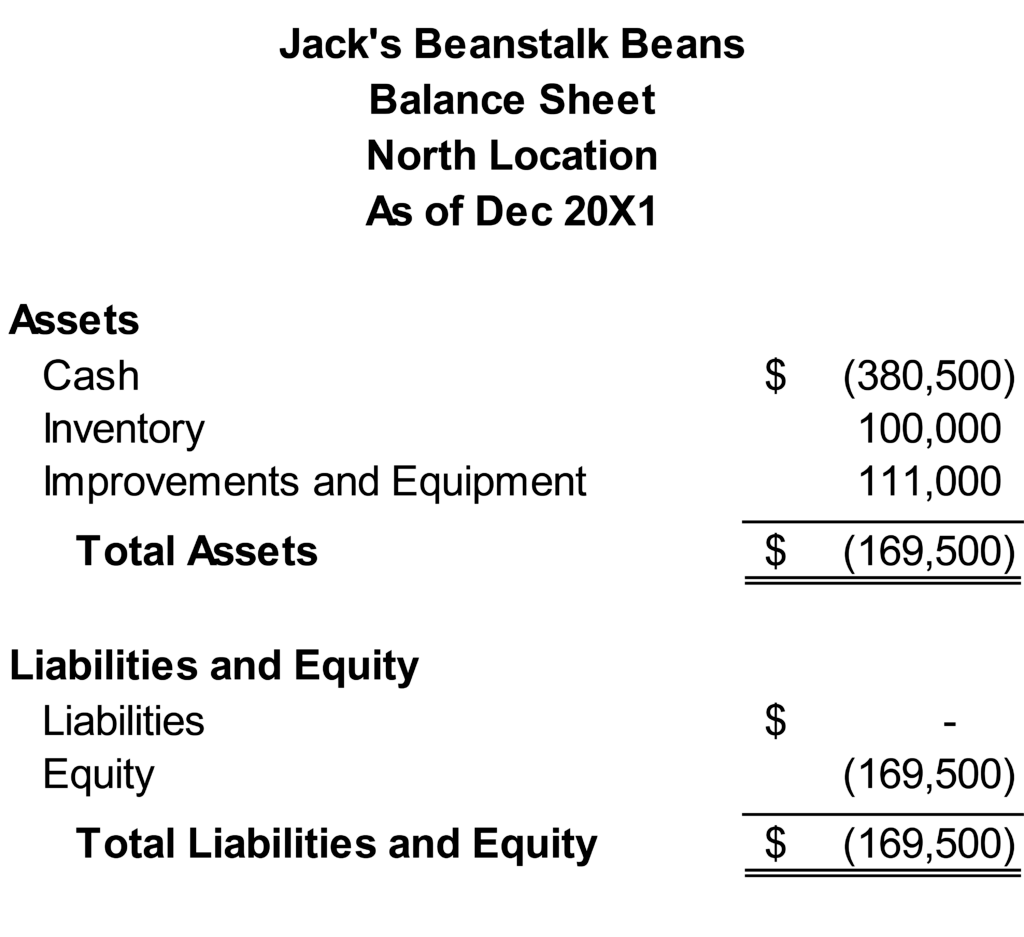
Equity for the location is negative $169,000, which matched the total loss on the contribution statement.
Simplifications and Options
I’ve mentioned a few assumptions made in this example so far that have greatly simplified the balance sheet for example purposes. This is obviously a simple set of financial statements to show some of the key points throughout the course.
Let me briefly mention a few options and complexities you can add to this. Most of these are reflected in the balance sheet.
- First, some of you CPA types out there may have noticed that this balance sheet doesn’t reflect the recent lease standards. Those would require me to add a right-of-use asset and a liability. You may want to model these if they could cause you to fall outside a debt covenant ratio.
- In this example, all inventory was paid with cash, and sales were also received instantly like cash. It’s more likely that a company buys inventory on credit and may also sell on credit. This would create accounts receivable and accounts payable. I showed earlier how the timing of these items in your cash conversion cycle could create permanent working capital that needs to be funded.
- Jack is leasing, so this example doesn’t show a building on the balance sheet and a cash outflow for a down payment. These are significant amounts that you want to model if you are buying or building a new location.
- A best practice is to do a break-even analysis and sensitivity analysis on the projection. I have an article that explains how to do this, using the example worksheet above, using Excel Goal Seek.
And finally, if all this still seems too fanciful, please remember that we’re discussing an analysis of a fairy tale company that sells magical beans.
Worksheet Options
In this article, I walked through a complex worksheet example from my Analyzing Whether to Add New Locations course. I explain how to decide if a new location is right for you. I also provide much more information about how to estimate many assumptions made in the examples above.
For more info, check out these topics pages: