If you asked 100 people for a revenue projection for a new location, you would probably get 100 different answers. When a group has many options to decide between, it’s very hard for them to make a decision. Getting to a decision with this many options takes lots of time.
I’ve had many sales projection conversions over the years that start like this:
Me: “What do you think sales will be in the first year for the new location we’re thinking about doing?”
Person I’m Meeting With: “I don’t know.”
Yes, they truly don’t know. This is a fact, but it’s not very helpful for building a projection and making a decision on whether to open the new location. How do we move the conversation forward?
A simple way to do this is to see if the company leaders think the new location sales can exceed the break-even amount. I’ve used break-even analysis many times to help make major investment decisions at companies.
In this article, I’ll explain the benefits and basics of break-even analysis. I’ll then walk through an example analysis to show how it works.
What is a Break-Even Point?
Break-even is usually defined as where revenue equals cost so profit is zero. Your business has reached a point at which the production cost is equal to the revenue earned from the product.
Most businesses aren’t aiming to just break even with no profit. They expect to make some sort or profit or hit some key ratio. They may want to at least cover their cost of capital. This means the relevant target in a break-even analysis may not just be “breaking even” with no profit. It may be some higher profit amount, like covering your cost of capital.
I provide a template for finding your breakeven points in my Finance and Strategy Toolkit (FAST) membership.
What is Break-Even Analysis?
Break-even analysis is a version of sensitivity testing. Sensitivity testing analyzes the impact on an outcome from changing one or more inputs. You should do sensitivity testing for the potentially important assumptions in a decision.
In break-even analysis, you identify the break-even point for one or more important assumptions. For example, what is the break-even point for varying amounts for:
- Sales
- Average sales price
- Average cost per unit
- Overhead costs
The Benefits of Break-Even Analysis
Here are some ways that break-even can help you make better decisions:
Smarter Pricing
The break-even analysis of your company helps you to set the price of your products. Break-even analysis helps you to understand how pricing will affect your profitability. I have a Price Change Analysis Worksheet that calculates the break-even volume and prices for you.
Manage the Size of Units
The break-even point helps to determine how many units you need to sell to cover the expenses. The selling price, the variable expenses, and the total costs involved are required for this evaluation.
Set Sales Targets
The break-even point helps you to understand how much you need to sell to earn a profit. This helps you to set revenue goals. With a number in mind, it becomes easier to set a sales strategy.
Set a Budget
This analysis helps you to understand at which point your company can break even. With the calculation, it becomes easy for you to set a budget for the organization. This analysis can be used to set realistic targets for the organization.
Decisions Based on Numbers, not Emotions
The break-even analysis helps you to make smarter business decisions. It limits the decisions made on emotions. The break-even point helps businesses to make decisions based on facts and figures.
Manage The Margin of Safety
During a financial slowdown, sales tend to decrease. How big is your margin of safety in sales before you start losing money? The break-even point helps you to understand the number of sales needed to make profits.
Fund Your Business
A proper break-even report can attract potential investors to your business. This financial analysis proves that your business plan is viable. This helps you to produce investment quotations before your investors.
What Is the Break-Even Point Formula?
The break-even point of sales units is the fixed expenses divided by the differences between the selling price and the variable costs. The break-even point formula is:
Break-Even Point = Fixed Costs ÷ (Selling Price – Variable Costs)
Here, the fixed expense is the overhead costs for the firm. On the other hand, the selling price and variable costs are the per-unit costs for the products. The denominator of the equation is the contribution margin. The contribution margin is used for the payment of your company’s fixed costs.
Fixed cost is the cost of utilities, rent, administrative wages, etc. Profit generated is the selling price per unit. The variable costs are the costs of labor and materials needed for production.
Let’s say your fixed costs are $10,000, your price is $500, and your variable costs are $100. Your break-even sales units are: $10,000 ÷ ($500 – $100) = 25 units
Not a fan of remembering this formula or doing the math? The U.S. Small Business Administration (SBA) has a great break-even point calculator that walks you through the concepts and calculation of break-even.
Another option is using Goal Seek in Excel to find your break-even point. I show how to do that here. Goal Seek can also be used to find the sales needed for any target profit you wish.
An Example of Using Break-Even Analysis: Opening a New Location
Opening a new location is usually a yes/no decision. You will open the new location, or you won’t.
This is matched with the binary decision of whether we think we can sell enough to hit our break-even amount, however you define break-even. If we can hit the break-even amount, we should open the store. If we can’t, we shouldn’t.
Let me pause and reassure you that this is not the complete basis for making the decision. This is just one way to analyze the decision. You could think of the decision as answering three questions with increasing amounts of complexity:
- Can we sell enough to break even? (Answered with break-even analysis)
- What is our likely profit? (Answered with a net contribution forecast)
- Are we comfortable with the range of potential outcomes? (Answered with sensitivity and scenario analysis)
My Analyzing Whether to Open a New Location course walks you through these steps and other ways to make smart choices when opening locations.
In a sales break-even analysis for a new location, you test the most uncertain variable in the revenue projection. That’s units sold.
Let me break down the basic variables of a revenue projection. This helps explain why we’re isolating units sold as the single variable to test in the break-even analysis.
Your gross revenue is your units sold times their price. My guess is that you are more certain about the price you will set your products at than the number of units you will sell at the new location. The uncertainty about the number of units is why we’re analyzing that as the input variable in the break-even analysis.
Categorizing Costs for Break-Even Analysis
Break-even is a profit analysis, so we need to look at the cost variables. There are two main categories for these:
- Variable Costs: Costs that vary with the number of units sold
- Fixed Costs: Costs that don’t vary with the number of units sold
In my marginal profitability course, I talk about a third category of costs called “step fixed” costs. Variable costs go up with each unit produced. Other costs, like machine costs, don’t go up with each unit. Once you reach your machine’s capacity, you must buy a new machine. In other words, your costs don’t increase until you cross a threshold and then need to make a significant increase in costs. That’s a step fixed cost.
In the context of a new location, you may need to hire another employee when sales hit a certain level. Commission of bonuses may take a big step up when sales at the new location reach a certain level. These are step fixed costs. For simplicity, I won’t model these in the examples below. You will need to add them to your formulas if you have them.
Variable costs are not the same as direct costs or cost of goods sold (COGS). Inventory costs of a retailer or materials costs in a manufacturing plant are variable costs and direct costs. If you have salaried employees, their time may be directly tied to producing a good or providing a service. However, the amount you pay them doesn’t vary with the number of units produced or hours of service billed.
This is also true of people paid hourly wages that work the same number of hours regardless of the number of units sold. For example, in a retail store, you will pay a certain number of employees the same amount whether you make zero sales up to a certain amount. Once sales reach that amount, you will have hourly staff work more hours (a variable cost) or add salaried staff (a step-fixed cost).
Calculating Potential Profits
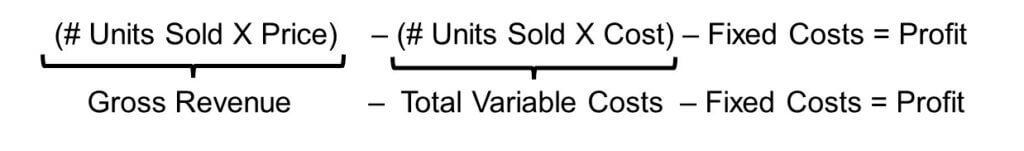
You’re ready to calculate the profitability at your new location across multiple sales amounts once you’ve categorized your costs as variable or fixed. The formula is:
We can enter different sales unit amounts to derive the related profit. This is called Cost-Volume-Profit (CVP) analysis.
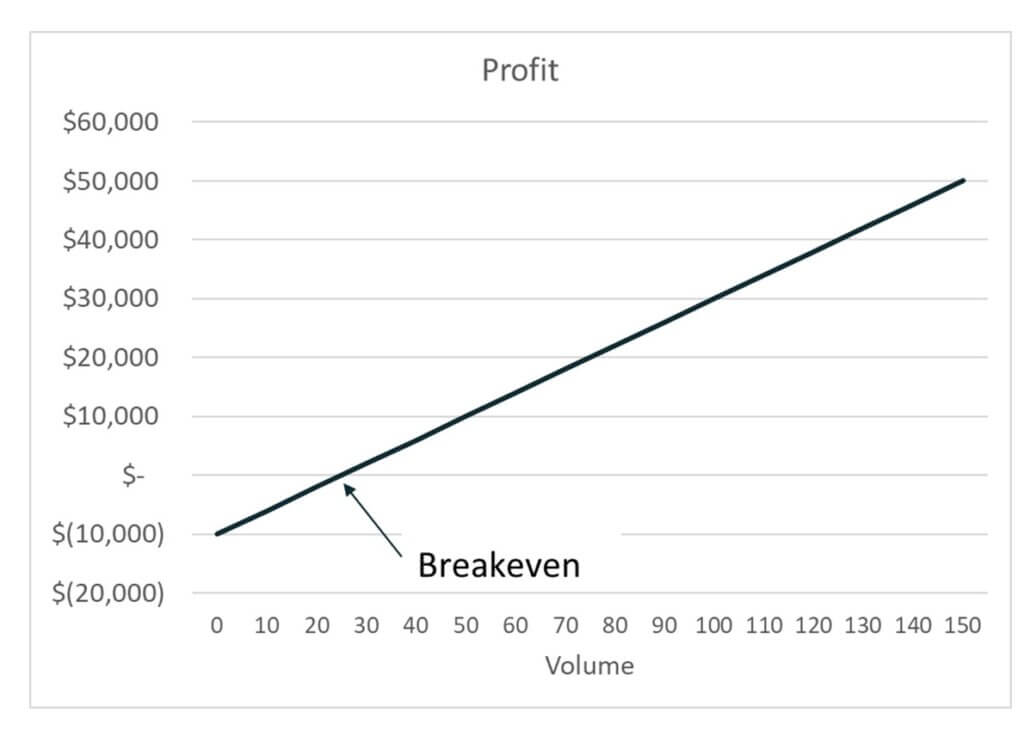
This can be graphed into a CVP graph. The graph can show us where we “break even.”
Cost-Volume-Profit (CVP) Example
Let’s assume the price of your product is $500, and the variable costs are $100 per unit. You have fixed costs of $10,000. You can assume different units sold to determine varying profit amounts. The formula is:
Profit = (# Units Sold X $500) – (# Units Sold X $100) – $10,000 Below is a graph of the profit from selling zero to 150 units:
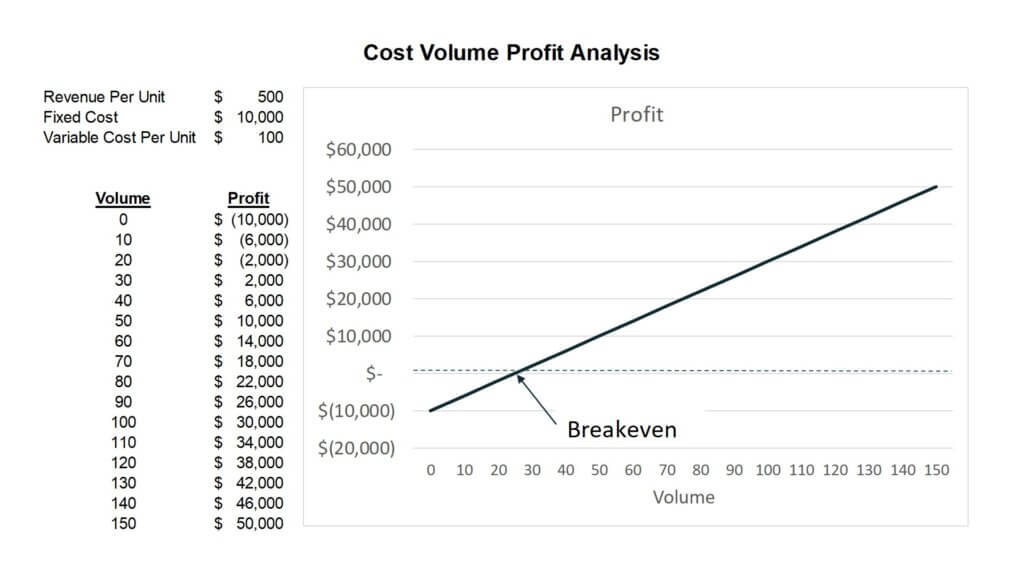
You can see from the table of values above and the graph that you break even somewhere between 20 and 30 units sold. What if you want to know the exact number of units you need to sell to break even? The formula for this is:
(# Units Sold X $500) – (# Units Sold X $100) – $10,000 = $0 Profit
Using a little algebra, this formula can be restated as a version of the break-even formula we looked at earlier:
Units Sold = ($0 Profit + $10,000 Fixed Costs) ÷ ($500 Price – $100 Variable Cost)
The break-even number of units is 25.
You may be tempted to simplify the restated formula to: Fixed costs divided by your gross profit. That’s not correct unless your cost of goods sold or direct costs are also all of your variable costs and don’t contain any fixed costs. This gets back to what I said earlier about categorizing costs.
What You Can Learn from Cost-Volume-Profit (CVP) Analysis and Break-Even Analysis
It’s time to pull away from the detailed numbers and look at what we can learn from the CVP graph and break-even analysis.
The CVP graph is a simple way to see your potential profit across a wide range of sales amounts. This is a simple form of sensitivity analysis. Every leader in the company likely has a number in their head of the number of units they think the new location can sell. They can quickly see how much profit that produces and what the profit becomes if sales are a little above and below that number of units.
The point where the line hits $0 profit is your break-even volume. The big question for decision-makers is, “How confident are we that we can sell at least this many units?” To simplify that to a yes/no question, the question is, “Can we sell at least the break-even volume of 25 units?” This takes the analysis of all the possible outcomes of whether to open the new location to a simple yes/no question.
Once again, you shouldn’t make your decision purely on break-even analysis. It is a good way to help the group gain clarity when they are overwhelmed by too many options and outcomes.
As I mentioned earlier, the break-even point may not be the critical “yes/no” point for you. For example, you may want to make at least $10,000 to justify the commitment of time and capital for the new location. You then ask the same question: “Can we sell at least the 50 units needed to make $10,000 of profit?”
I’ve been in meetings where a huge amount of time was spent debating the likely amount of units the new location will sell. Especially in the early stages of analysis, that time could be better spent on other questions. If you are confident you can hit the break-even or target volume (or some other minimum threshold you set), you should continue pursuing the new location. Then work on expected likely volumes in future analysis.
A group may not agree on an expected likely volume but may agree on a range of volumes. This range will map to a range of potential profit amounts. The group can decide if the returns are reasonable.
In the early stages of analysis, spend less time on the details of a more likely scenario and focus on the range of outcomes. You will need to lock in the more certain assumptions to allow the less certain and more crucial assumptions to vary.
In the analysis we looked at, you want to have reasonable price, fixed cost, and variable cost assumptions. This allows you to vary the uncertain sales amounts. Later, set a forecast volume amount for more detailed analysis or to do sensitivity analyses of other variables.
The Clarity Provided by Break-Even Analysis
For small businesses or new ventures, break-even analysis is crucial. It provides the finance team with practical information about costs and expenses. This financial analysis helps management to set a pricing strategy. An existing company can use this analysis while launching a new product or opening a new location. It’s a simple way to reduce the complexity of major decisions.
For more info, check out these topics pages: