Most break-even analysis examples are for one product. That’s very useful to those of you who sell only one product. For the other 99% of you, I’m happy to say that there are ways to do break-even analysis for multiple products.
Two-Product Table
If you only need to find mixes of two products that lead to a target profit, you can use a table like the two-way data table below.
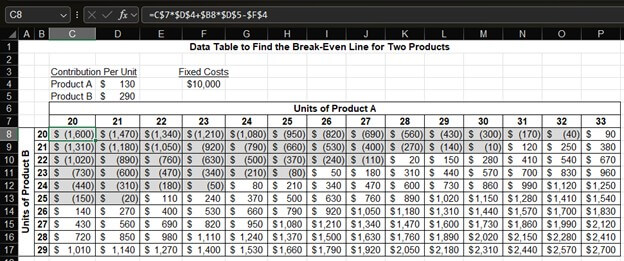
The above example calculates the total profit for two products that are cleverly named Product A and Product B. The contribution margin for each product is in cells D4 and D5. The fixed costs are in cell F7.
I manually created the formulas for this data. You could also use Excel’s data table functionality. The formula for cell C8 is in the formula bar at the top of the image. That formula is copied throughout the rest of the table.
I highlighted the negative profit amounts in grey to more clearly show the break-even line for mixes of Product A and Product B.
Using a Set Sales Mix
Life is always easier when you are solving for only one variable. Having three products in break-even analysis means solving for three contribution margins. We can solve for them as one variable by setting a constant sales mix.
This next example is a case study of the three pigs of fairy tale fame. They have a construction company that builds three types of homes:
- Straw: Temporary but functional summer homes that provide nice shade.
- Sticks: These mid-priced homes sell well in breezier locations like Kansas. Fun fact: Dodge City, Kansas, is the windiest city in the United States, according to Wikipedia.
- Bricks: These expensive structures are sold in areas with a large wolf population, like Alaska and Wall Street.
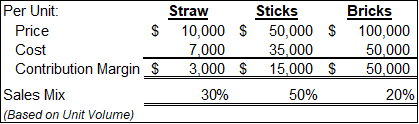
Here are some assumptions about their products:
Some people may object that the housing prices in this example are completely unrealistic given current housing prices. I have two points in reply:
- These are very small, pig-sized houses.
- We’re talking about fairy tale pigs running a housing construction company, so please cut me some slack.
We will use the above assumptions to construct a weighted average contribution margin (WACM) that’s used in place of the single-product contribution margin in earlier CVP and break-even calculations. Here’s how the weighted average is calculated:
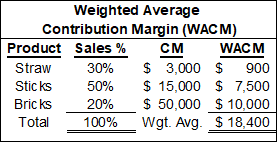
Each product’s sales mix percentage is multiplied by the contribution margin for that product. The sum of those products is the weighted average contribution margin, which is $18,400 in this example. For you Excel formula fans, you can also calculate the WACM with the formula =SUMPRODUCT(column of sales %, column of unit contribution margins).
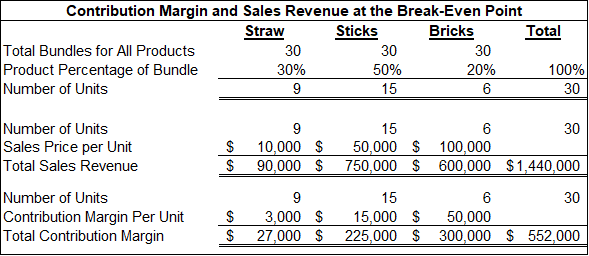
In a recent 10-K filing, the three pigs disclosed that their fixed costs are $552,000. I showed earlier that a quick way to calculate the break-even point is to divide the fixed costs by the contribution margin. In this example, that’s $552,000 / $18,400 = 30. They need to sell 30 of these bundles to break even.
Now, let’s translate that to sales. The table below shows the process for this. First, we calculate how many units of each product are sold in 30 bundles. We then multiply the number of units of each product by their sales price to get sales revenue. I also multiplied each product’s units by its contribution margin to show that the total equals the $552,000 that we calculated earlier. The $552,000 contribution margin exactly offsets their fixed costs for a profit of $0.
The pigs could use the Cost-Volume-Profit (CVP) formula to model different prices and mixes of their three types of homes. They may find a price point and mix that maximizes profit and reduces the break-even sales.
Behavioral finance studies have shown that people tend to pick the middle option when presented with three options, like the house options. The pigs may find that they can raise the price on the middle-priced “sticks” house without reducing sales of the other two products. This increases the unit contribution margin of a stick house. This will dramatically increase profits and reduce the break-even point.
Another similar behavioral finding involves restaurants, but it likely applies to many industries. They found that sales increased for an expensive item when a more expensive item was added to the menu. Say a restaurant sells hamburgers, chicken fried steak, and New York steaks. They then add an expensive filet mignon. They may now sell fewer burgers and chicken fried steak but increase the number of New York steaks they sell. They may also sell a few of the new filet mignon option. Is this good? It depends on the contribution margin of each product. Selling pricier menu options doesn’t always mean increased profits. They would want to run a CVP analysis. I’m sure our three pigs would be elated if people ate more beef and less pork.
A Wall Street adage is, “Bulls make money, bears make money, pigs get slaughtered.” That may be true, but they may not have run into a pig that can run CVP analysis.
Combining Concepts: A New Bank Branch
I’ll combine some concepts we’ve covered using an example from my banking days. I’ll explain this scenario conceptually to show how the concepts can be practically used without getting into the details.
Banks often offer certificate of deposit (CD) accounts with very high rates when they open a new branch. It’s a way for them to get people in the door to hopefully cross-sell more profitable products over time. Sometimes, the contribution margin on these CDs was negative. The only way I could justify these high rates was to treat them in my mind as marketing expenses masquerading as interest expenses.
As I said, we hoped these customers at these branches would eventually migrate to a profitable product mix like other branches. They would have a mix of checking, savings, CDs, and other services. I could calculate the weighted average contribution margin for this mix.
We can now calculate combinations of the weighted average contribution margin of the profitable product mix and the high-yield CDs in a data table. This would show when the total contribution margin starts to exceed the high fixed costs of a new branch. If the high-yield CDs have a negative margin, then the break-even volume needed from the profitable product mix is higher than that of an existing branch.
It takes time to cross-sell new products. People slowly transfer their checking and savings balances. The data table shows the volumes at which the branch breaks even for a month or year. A time-series analysis, like payback period analysis, shows how long it takes until we first hit that volume and how long it takes until the total profit for the branch since inception is positive.
In case you’re wondering how long it takes for a branch to break even, the answer is: a long time… a very long time.
Multiple Mixes with Multiple Products
Once you get beyond two products, you move beyond the virtual plane of a spreadsheet. Once you try to solve for more than one variable (e.g., multiple product mixes or products with multiple contribution margins), you get into complex formulas.
Some options include:
- Scenario analysis
- Monte Carlo analysis
- Modeling software
- Using Visual Basic (VBA) or macros in Excel to run multiple mixes and save a record of the results
For more info, check out these topics pages: