Traditional budgeting can be classified as functional budgeting. Maybe you consider it dysfunctional budgeting, which is a great joke. Functional refers to departmental budgeting, not the budget’s effectiveness. Activity-based budgeting focuses on the activities that drive costs before assigning those costs to objects.
Activity-based costing (ABC) practices have greatly improved cost analysis over the past few decades. Using the principles of ABC, activity-based budgeting (ABB) improves budget accuracy. I’m not going to get into the details of how to implement ABC and ABB. I will explain them conceptually, how they are related, and their potential benefits. First, we need to start all the way back with traditional costing.
Traditional cost practices started with the easiest cost tracking. It did a good job of allocating direct costs to products. It used more arbitrary methods to allocate overhead. This is fine if overhead is a small part of expenses. It becomes dangerous when overhead is large. It can lead to bad product unit costs, which lead to bad decisions.
To be fair, this was done before computers when calculation and reporting capabilities were limited. For simpler companies with low overhead, the benefits of more advanced costing didn’t exceed the cost.
Activity-Based Costing
As overhead costs increased, simple assumptions could no longer be used to allocate them. At the same time, computing costs and software sophistication increased, reducing the cost of analysis.
In activity-based costing, resource costs are first allocated to activities. Activity costs are charged to objects based on the number of activities the object “drives” or causes. Traditional costing usually allocates resources directly to objects. It often uses an allocation method that’s less accurate than using ABC’s activities.
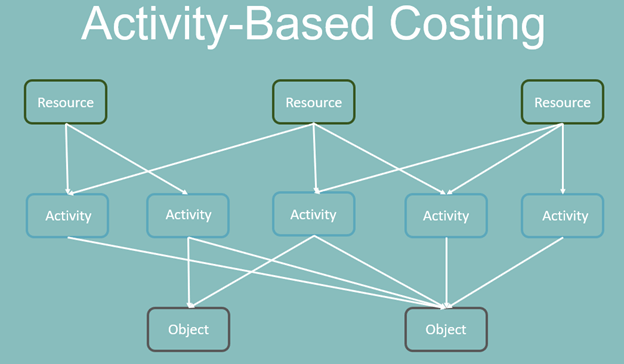
Below are the definitions for resources, activities, and cost objects:
- Resources – Resources are what’s used or consumed in company activities. These can be identified in the costs and assets of the company. It’s the costs of staff and materials. More broadly, it includes the intangible assets of the company, including those not captured in the balance sheet.
- Activities – This is what happens in a company. It’s what people or processes “do.” As they do these things, resources are used. Once again, these resources may be people’s paid time or the materials that they process.
- Cost Objects – The activities are performed on behalf of, and driven by the demand from, the cost objects. Cost objects are often products or services. A market or customer can also be a cost object.
Activities can be categorized by what causes each unit of activity to occur. Below is a table of sample categories:
| Activity Category | When a Unit of Activity Occurs | Example |
| Unit activities | Occur with each unit produced or sold | Cost of a component part and the labor needed to install it |
| Batch activities | Occur when setting up a production batch, regardless of the number of units produced in the batch | Setup of a production machine for a batch |
| Product activities | Occur for each product, regardless of the batches and units of the product produced | Package design |
| Customer activities | Driven by customer actions and not by the number of units produced | Customer service call |
| Market activities | These occur for a market, regardless of the customers, products, batches, units, etc. | Market-specific marketing campaign |
| Entity-sustaining activities | These are the “cost of doing business” regardless of the amount of business, customers, or markets. | Monthly financial statements, annual tax returns |
The ABC diagram above shows a single row of activities. This is a simplification. Costs may first be driven to an activity level, and then that level may be able to be allocated to items in another level. This step allocation could occur multiple times before being traced to the ultimate cost objects.
Benefits of ABC
ABC improves cost measurement. Its benefits also go far beyond that. Below are a few benefits.
More Accurate Profitability Analysis
ABC allocates indirect and overhead costs more accurately to products or other objects than traditional costing.
Customer profitability is more accurate because costs are assigned to customers based on the cost activities they have driven. Different customers drive different levels of activities and costs. A company can now calculate these per-activity costs and track their frequency. Customers who cause more activities (e.g., transactions, services) are charged more expenses in customer profitability analysis.
Channel profitability and pricing are improved. In banking, we could decide how much mobile banking transactions cost versus branch transactions. We could then encourage customers to use more profitable or less costly channels.
Process Clarity
ABC breaks the “black box” of overhead costs into a series of identifiable actions for which there are costs. This has many corollary benefits:
- Better identify inefficiencies and waste: The process documentation of ABC goes hand-in-hand with process improvement methodologies like Lean Six Sigma. In Lean Six Sigma, each process must prove how much value it provides, especially to the customer. The linkage from one activity to the ultimate customer is clear and traceable from the ABC activity linkages.
- Capacity management: Knowing the total and remaining capacity of assets and resources is crucially important to profitability. Capacity constraints limit production. Increasing capacity often triggers step fixed costs. Marginal profitability is very high for production that uses excess capacity. It’s much lower when production triggers high marginal costs. ABC helps assess the potential capacity of resources and the actual amount consumed by activities.
- Clear process linkages: ABC maps linkages from customer actions to production activities and then to overhead activities. It’s not possible to estimate how many extra HR staff would be needed if production tripled without this activity linkage. I’ll expand on this later.
- Assess “budgetary slack”: ABC provides an excellent way to challenge “budgetary slack” or sandbagging that’s rampant in budgeting. Past relationships between revenues and costs provide solid evidence for estimating future costs. Expenses in excess of this must be challenged.
Justification for Resource Allocation
ABC helps define a cultural battle that wages in many companies. It becomes even more pitched during budgeting when managers compete for scarce resources.
Activities drive other activities. Costs cause costs. That may not always be clear, but ABC is a good way to bring it to light.
Here’s (a slightly caricatured account of) how the battle plays out.
- Sales staff: Sales staff claim to be the “rainmakers” that bring in all the revenue. They claim a small investment in salaries and staff for them is leveraged into massive revenue increases.
- Production staff: Production employees contend that they actually create the product or provide the service the customer wants. They do the “real work” for what the customer gets. They see sales as just glad-handing pretty-people order-takers. They demand more resources if sales go up to pay for the increased costs of materials and to hire more people.
- Overhead departments: Both sales and production staff consider overhead departments to be blood-sucking leeches. They suck away profits created by sales and production while trying to tell everyone what to do. More specifically, budget season is when the rest of the company feels that the financial overhead people are sucking copious amounts of the life-blood resources from the company.
Sales staff can easily claim they need resources because those resources improve revenues. Production staff can easily point to the variable direct costs that will go up from increased sales. How do indirect and overhead teams justify their need for more resources when production and revenues increase? Isn’t overhead a fixed cost that doesn’t need to go up with production?
Overhead provides services, but what drives those services is very indirectly linked to units of sales or production. The costs derive from different activity categories like product, market, or entity-sustaining activities. The number of employees, locations, and departments also increases activities and costs for overhead departments.
ABC shows this connection of activities. The nebulous “fixed cost” perception of overhead is broken into component activities which can be assessed for capacity utilization.
Thus, accountants and financial analysts may implement ABC if only to justify their existence. It shows the benefits they provide directly to internal customers and indirectly to external customers. It substantiates their costs and might even clarify their purpose for living—or at least their purpose for showing up for work.
Activity-Based Budgeting (ABB)
As I’ve said before, budgeting is accounting in reverse. However, the budget follows the sequence of events as they occur in real life.
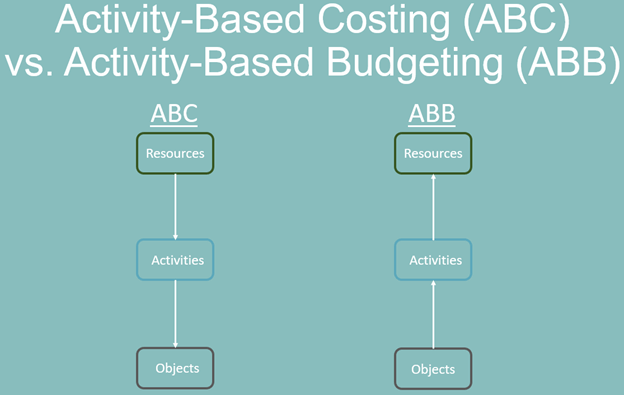
In ABB, customers are going to buy products and services (i.e., “objects”). This will cause our company to perform activities to meet customer demand. These activities will consume resources and create costs, which will be recorded in the budget. The image above shows how the flow of the analysis in ABC is the opposite of the flow of how costs are compiled in ABB.
This leads to a common budgeting flow chart:
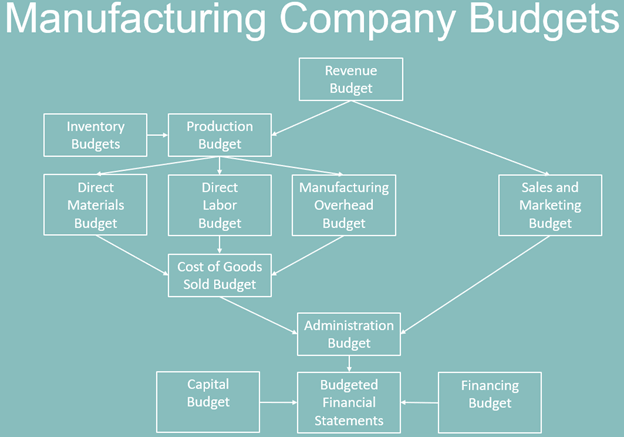
The flow chart starts with the key revenue budget assumption of volume and price. That drives the production activities. We know intuitively that those activities will drive other activities in overhead departments. ABC helps us quantify those activities and the related resources of costs.
Instead of one big arrow from the cost of goods to administration or one big arrow from production to manufacturing overhead in the budgeting flow chart, ABB has many arrows. Each arrow is an activity driven by another activity. Each of these arrows has a cost per activity.
The job of everyone in the budgeting process is to estimate the volume of activities and the price per activity. This should sound familiar. This is the concept I explained earlier of how an income statement is just a collection of volumes and prices.
However, ABC and ABB make a crucial change in cost categorization from traditional budgeting and costing. GAAP income statements, like many budgets, categorize costs by organizational structure. The budget is likely set by the manager of each department. They are “Finance’s expenses,” “HR’s expenses,” and “IT’s expenses.”
Senior leaders may challenge these budgets if budgeted expenses are much higher than past actual expenses. They will demand, “Why are your costs going up so much?” The logical leap from sales goals to the functional budgets of overhead departments is massive. It can’t be made in one intuitive leap; it’s better understood step-by-step via activities.
The answer may be ABB. In the lesson on testing budgets, I mentioned that one test is to compare past ratios between staffing and volumes to budgeted levels. This is a rough estimation of correlation. This is like the “leap” of logic.
An overhead department manager knows that their staff is busy and more staff will be needed because the budgeted revenue is higher than this year (and, yes, budgeted revenue is almost always higher than past actual revenue). That intuitive linkage is shown in the web of ABC activity linkages. The amount of additional resources needed can be calculated from ABC data from Finance. Once again, Finance saves the day, or at least the budget.
Which Unit Costs to Use
Can we just take the budgeted number of activities times the ABC unit costs to calculate our budget? NO.
The average historical cost for an activity per an ABC analysis is not its marginal cost. As more items are produced and more activities are performed, the capacity utilization changes and cost efficiency changes. There may be large differences in costs in the future for additional items. For example, past material or labor costs may be much lower than future material or labor costs.
However, the analysis used to create the activity costs is an excellent starting point for calculating marginal costs.
Cost is a function of capacity. If there is excess capacity, then marginal costs are very low to zero. If capacity is exceeded, then a step fixed cost will need to be incurred. Overhead costs are primarily step fixed costs (e.g., hiring a new employee). ABC does an excellent job mapping the activities and the time (i.e., capacity utilization) of these activities done by indirect and overhead departments.
Cost is a function of capacity.
Capacity utilization is a function of the number of activities. ABC can help managers determine the capacity of a resource. The process management of ABC can help improve the efficiency of the resource to increase its capacity. Process management may also change the process flows of bottlenecks.
Mapping the revenue target to activities allows managers to check if there are enough resources for that level of activity. Many surprise expenses are due to poor capacity assessment during budgeting.
ABB Example
Let’s look at a simple activity-based budget analysis and capacity utilization scenario. The example narrative is based on this image:
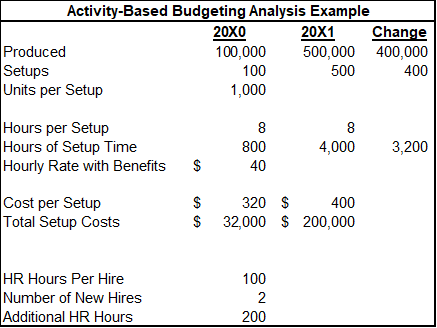
Let’s assume ABC company produced 100,000 units of Product A. This required 100 production batch setups. This equals an average of 1,000 units per setup.
Each production batch setup takes eight hours of labor. At $40 of salary and wages, each setup costs $320, and the total setup cost that can be allocated to the product (and its 100,000 units) is $32,000.
The CEO just announced that they are going to “5X sales” in the budgeted year. Let’s assume that means they will need to 5X their production. 500,000 units divided by last year’s standard of 1,000 units per setup equals an estimated 500 setups.
The ABC cost per setup was $320, but this has been adjusted to $400 per setup for next year. Labor costs, including costs to lure new workers to the company, are expected to be higher in the budget year.
At eight hours per setup, the total setup time will be 4,000 hours. This is 3,200 hours more than last year and equals roughly 1.5 FTE (full-time equivalents). They will need to hire two people for this.
HR calculated that it takes them 100 hours to process each new hire. This includes recruiting, screening, interviewing, onboarding, and training each new employee. Hiring two people for setup will cause 200 hours of work for their department.
If this was the only additional work for them and they had excess capacity, they wouldn’t have to hire another HR person.
If they were at capacity, they would have to hire another HR person to have time to hire the two setup people. Ironically, hiring the HR person also causes another 100 hours for the HR department. It’s another iterative loop in budgeting.
The ABC work that calculated the hours per setup, units per setup, and hours per new hire allowed the company management to quickly budget the number of new hires needed solely due to the setup. The number of new hires was contingent on capacity assessments of current staffing.
Pros and Cons of Activity-Based Budgeting (ABB)
ABB has many compelling benefits. It can slowly be integrated into budgeting as ABC analysis is done on processes or departments. It also has some drawbacks that need to be considered.
Pros of Activity-Based Budgeting
- More accurate budgeting: By focusing on activities, activity-based budgeting can provide a more accurate picture of all the costs associated with budgeted production levels.
- Better resource allocation: ABB allocates resources more effectively by identifying and prioritizing the activities that create the most value. Capacity management is greatly enhanced.
- Improved decision-making: With a more detailed understanding of the costs associated with various activities, ABB can help managers make better decisions about what products to promote and which customers to pursue for increased profitability.
Cons of Activity-Based Budgeting
- Time-consuming: Activity-based budgeting can be a time-consuming process. It requires significant effort to analyze the costs of activities and the expected number of activities.
- Data requirements: ABB and ABC rely heavily on accurate data about the costs associated with different business processes. If this data is not readily available or is difficult to collect, the accuracy of the budget may be compromised.
- Complexity: ABC and ABB can be a complex process requiring a deep understanding of a company’s operations and activities. The web of activities can be complex. This complexity can be difficult to clearly communicate in a compelling way to create buy-in for it.
- Resistance to change: While ABB provides data to improve the projection of activities and costs. However, it may challenge the views of some managers that I covered in the company culture section. I’ve built profitability systems that produced results that some people had a hard time accepting. The results I calculated were based on information and assumptions from them. ABC can produce very different profitability results than traditional costing methods or management intuition. ABB does a better job of capturing all the costs of growth. This makes it harder to hit budget profitability targets by increasing growth. This may not be a con, but it is a challenge.
Check out my Better Budgeting course to learn about other budgeting options and how they can improve your budgeting process.
For more info, check out these topics pages: