We can use working capital metrics to project future working capital balances. This article explains how to do this.
Creating Cash Projections
Forecasts and budgets are often driven by sales projections. They are often based on accrual accounting. We need to translate that to a cash forecast for cash flow planning and to create the financing budget. It also helps us estimate inventory purchases for operational planning. It will also help us project the accrual-based accounts receivable, inventory, and accounts payable balances.
Let’s first start with a very simple example of the importance of managing both accrual-based profit and cash flow. It shows how the lags in the cash conversion cycle cause cash to drop before increasing when a company has the opportunity for massive growth. Companies that aren’t prepared either have to pass on the opportunity or jump on it and then run out of cash.
Let’s say you built 100 widgets at a total cost of $80,000 and sold them for $100,000. Congrats! You just made a $20,000 accrual-based profit! Now let’s assume you paid for the cost of goods when you ordered them. Your invoices to customers said their payment was due in 30 days. Your cash flow for your first month during production is negative $80,000. The following month, you receive the payments from your customers, so your cash flow spikes up to $100,000. That dip followed by a spike may not be a problem for a small amount. If you had a shot at a $2 million profit opportunity, could you find $8 million to pay for the cost of goods to capture it? Feel free to add as many zeros to my question to scale it to the size of your company.
We will now walk through an example using a company called Jack’s Beanstalk Beans. You may remember the story of Jack and the Beanstalk. Jack trades the family cow for magic beans. These beans grow overnight into a massive beanstalk that reaches into the sky, where a giant lives. Jack steals from the giant and then kills the giant as the giant chases after him.
It’s a fairy tale with a questionable moral ending for small children. It’s not every night that you soothe your child to sleep with a tale of theft and manslaughter.
I’m going to show an example of how to convert the gross profit for Jack’s Beanstalk Beans from an accrual basis to a cash flow basis. I “roll” the balance sheet items to show the activity in them for each month. The cash flow can be derived from rolling these accounts or can be derived via a formula, which I’ll also show.
Jack has estimated the following number of days for his cash cycle:
- Days Sales Outstanding (DSO): 45 days
- Days Inventory Outstanding (DIO): 60 days
- Days Payables Outstanding (DPO): 30 days
Adjusting Sales to Cash Collected
Jack’s budgeted sales are:
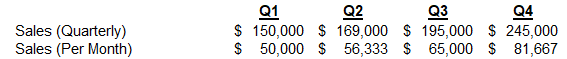
Since sales are collected after the sale, we must go back in time to find out the sales in the past year that we will collect in the current year. Jack’s sales in the last quarter of the previous year (Q4X0) were $120,000, or $40,000 each month.
For all calculations in this example, we will assume that each month is 30 days long rather than their actual length of 28–31 days. This is a valid assumption if transactions occur evenly throughout the month. If all your sales come on the last day, you may need to use actual days and may want to project cash on a weekly basis. This uneven cash flow can create big cash timing issues.
Here’s how the cash from sales and the accounts receivable(A/R) balances are calculated:
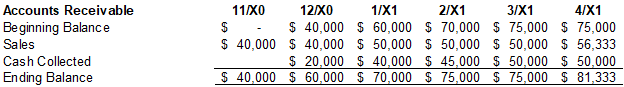
The calculation starts with sales. In November, all that’s in A/R in this example are sales. In December, Jack books another $40,000 of sales but also receives half of the November sales. Remember that cash is collected 45 days after sales. The sales from 11/1–11/15 are collected 45 days later, in the last half of December.
In January, enough time has elapsed for us to roll the balance fully. January sales are $50,000, which I showed in an earlier table. In January, we collect the last half of November sales and the first half of December sales. The formula is:
November Sales * 15 days / 30 days + December Sales * 15 days / 30 days
January’s ending A/R balance is the beginning balance + sales – cash collected.
You can also calculate the ending balance directly using the 45 days of sales outstanding. The formula for January would be:
(December Sales * 15 days / 30 days) + (January Sales * 30 days / 30 days)
If the DSO was 75 days, the formula for January would be:
(November Sales * 15 days / 30 days) + (December Sales * 30 days / 30 days) + (January Sales * 30 days / 30 days)
Adjusting the Cost of Goods to Cash Paid
Adjusting the cost of goods to cash paid requires two parts of the cash conversion cycle: Days Inventory Outstanding (DIO) and Days Payables Outstanding (DPO). We can also track the balance for Inventory and Accounts Payable (A/P).
Jack’s budgeted costs of goods are:
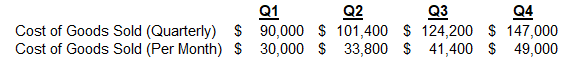
To roll inventory and accounts payable, we can track when the inventory cost of goods was purchased. Jack’s Days Inventory Outstanding (DIO) is 60 days, which equals two months.

For example, the $30,000 cost of goods expensed in January was purchased in November. Now, let’s roll the inventory balance. The timing of inventory purchases and cost of goods from the table above are in the second and third lines of the table below. Each column of the inventory roll is calculated as Beginning Inventory + Inventory Purchases – Cost of Goods Sold to arrive at Ending Inventory.
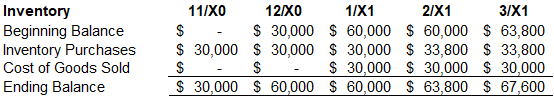
Jack’s Days Payables Outstanding (DPO) is 30 days, which equals one month. In other words, Jack pays for inventory one month after receiving it. This allows us to roll accounts payable.
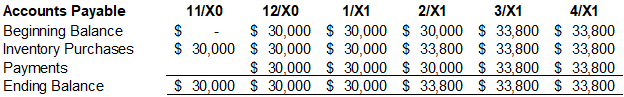
In the table above, Jack pays $30,000 in December for the $30,000 of inventory he bought in November. The inventory purchases come from the inventory roll image above. Each column of accounts payable is calculated as Beginning Balance + Inventory Purchases – Payments to arrive at the Ending Balance.
Using the tables above, we can now calculate the cash received from sales minus cash for inventory for our cash budget. Below is what it would like for the budget year summarized into quarters.
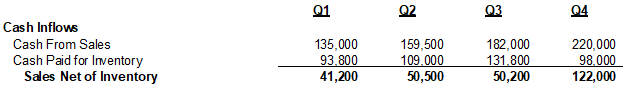
The cash received for the first quarter is the sum of cash collected from the accounts receivable roll for January – March. The cash paid for inventory for the first quarter is the sum of payments from the accounts payable roll for January – March.
Percentage Uncollected Method
An alternative way to budget the timing of cash received from accounts receivables is to use the percentage of credit sales that are received each month. Likewise, you can budget the timing of payments on accounts payable using the percentage of credit purchases that are paid each month. I’ll show an example using accounts receivable.
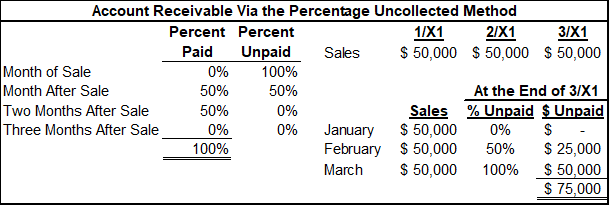
In this calculation, Jack receives 50% of sales the month after a sale and the other 50% two months after the sale. This tells us how much is left unpaid (i.e., still in accounts receivable) each month.
The right side of the example calculates A/R as of March. By March, Jack had received all of January’s sales but had only received half of February’s sales and none of March’s sales. The monthly sales of the past months are multiplied by the percentage unpaid as of March. The total of each month’s sales unpaid is the A/R balance.
For more info, check out these topics pages: