A cash flow or profit forecast answers, “What do I expect to happen?” You then use ratios and other metrics to answer, “Is that good enough to proceed?”
In this article, I’ll walk through three common metrics used to assess the return on investments:
- Net Present Value (NPV)
- Internal Rate of Return (IRR)
- Time to Break Even
I’m not going to give you the formulas for most of these metrics, but I will show you how to derive them in Excel. For you math fans, you can click on these links to dig into the formulas: IRR and NPV.
Net Present Value (NPV)
Net Present Value answers the question, “Is the current value of cash flows enough to justify this investment?”
The net present value of a series of cash flows is their value today. You can’t just add up the cash flows to get this number because one dollar today is worth more than getting one dollar in the future. This is called the time value of money.
The economic theory behind this is that if you give me one dollar today I can invest it to get more than one dollar in a year. For example, I can put in a savings account and get one dollar and three cents in a year. That assumes I’m perfectly rational and self-controlled. Economists’ assumptions aren’t based on normal people that have a knack for losing money from bad decisions, lack of control, or bad luck.
The huge assumption with NPV, aside from the cash flows, is the discount rate. What rate should you use? A good starting point is your weighted average cost of capital. In other words, what’s the weighted average cost of the funds you will use? Let’s say the company owners expect a 10% return on their cash and can borrow money at 6%. If the location is financed by cash, you would use 10%. If you were funding half of it with cash and half with debt, then you may use 8%. You should then adjust that for the riskiness of the project.
Using Excel’s NPV Function
Excel has two NPV formulas:
- NPV: The formula for this is =NPV(Discount Rate, Series of Values). One thing to note about the formula is that it assumes the cash flows occur at the end of a period. If most of your cash outflows occur at the beginning of the year, run the NPV formula for years 2-5 and then add the first year’s cash flows. That’s what I did in this example.
- XNPV: The formula for XNPV is =XNPV(Discount Rate, Series of Values, Dates for Values). This allows you to pair an exact date for each cash flow rather than using the “end of period” assumption of NPV.
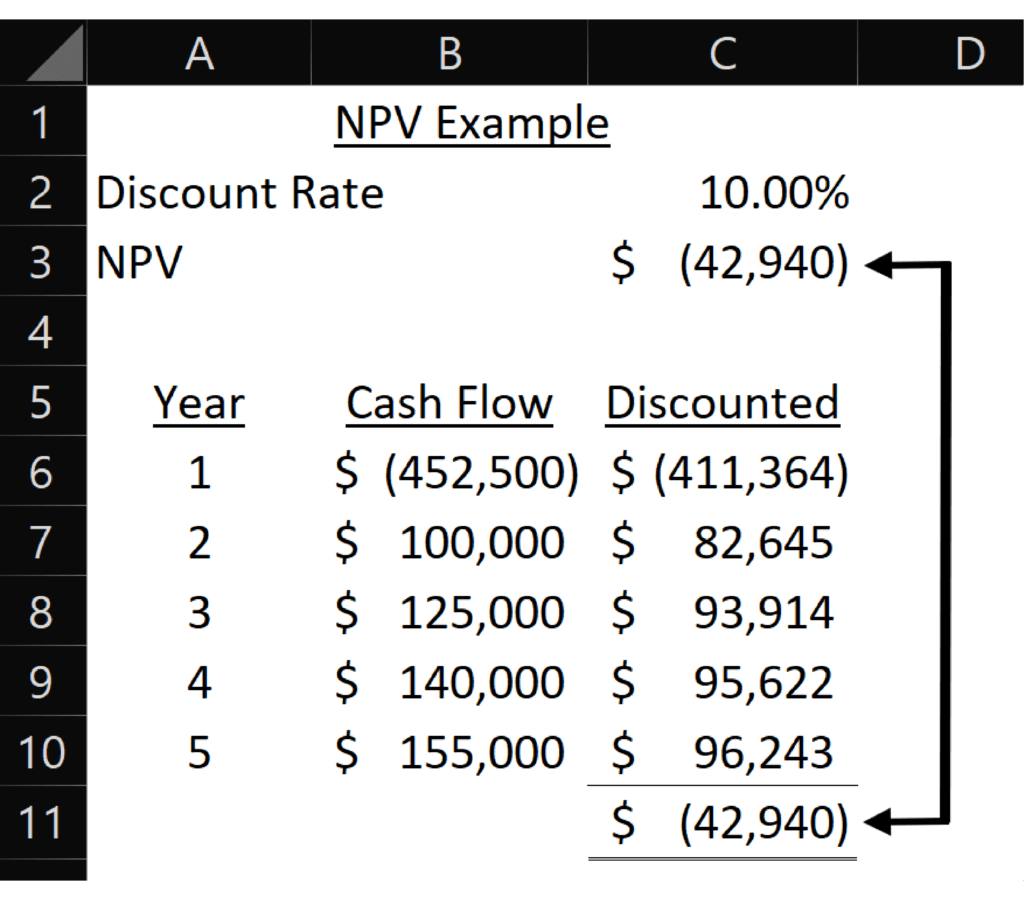
Here is a table of sample cash flows discounted by an assumed 10% discount rate.
The formula in cell C3 for NPV is: =NPV(C2,B6:B10). I also showed at the bottom of the image how each year’s discounted cash flow sums up to the total NPV of the project. The NPV function assumes that cash flows occur at the end of each period, which means the cash flow for year one occurs one year in the future.
What do you do if your cash flows occur at the beginning of the year? This is common since the initial investment often occurs on day one, while the cash flows of the investment occur over multiple years. In that case, you would discount the cash flows at the end of periods 1-4. Then add the initial investment as an undiscounted cash flow. The timing of the payments to be discounted is still a bit imprecise, which can be fixed with XIRR, which I’ll discuss later.
What you are hoping for is at least a positive number. Your discount rate should be the risk-adjusted minimum rate of return you would want from the project. When comparing projects, you would lean toward picking the projects with the highest NPV.
In this example, the NPV is negative, which means we may not want to open the new location. It may still make sense to open the new location if there are qualitative factors that offset the negative NPV.
NPV can change based on how many years you project. I only projected five years in this analysis. If I projected two more years of $155,000 of cash flow, the NPV jumps to $44,553. The longer into the future that you project, the less certain of the cash flows you become. This is why you may be OK with only projecting five to ten years in the future. If you are buying or constructing the location, make sure to put the sale value of the building at the end of the cash flows.
Using Excel’s XNPV Function
I mentioned earlier that Excel’s IRR function assumes payments occur at the end of each period. It also assumes that all periods are the same length. What if you want more precise dates for cash flows or if they occur at differing lengths of time? That’s when you use Excel’s XNPV function.
The formula for XNPV is =XNPV(Discount Rate, Series of Values, Dates for Values).
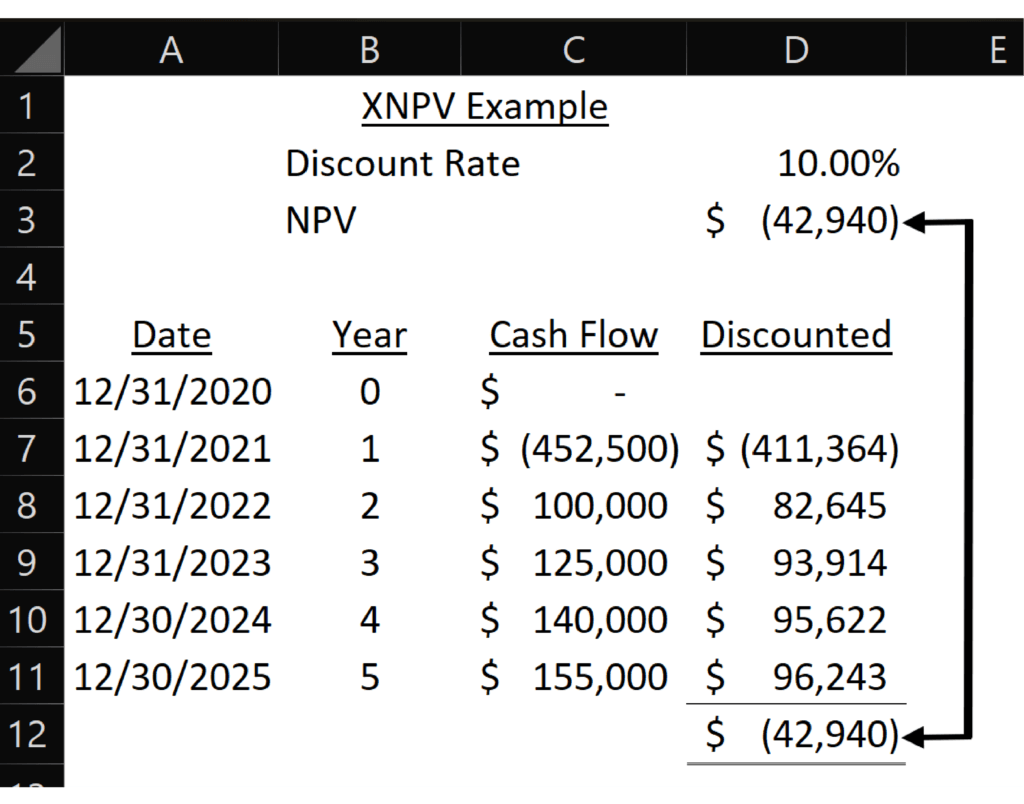
The formula for XNPV in cell D3 is: =XNPV(D2,C6:C11,A6:A11).
I set up this to match the NPV example, so the dates occur at the end of each year. The eagle-eyed auditor types out there may notice that the sum of the annual discounted cash flows doesn’t equal the XNPV formula. What’s going on?

Cash flows dated the last day of each year don’t all have the same length of time between cash flows. The discount rate I used on each yearly row assumes they do like the NPV formula does.
Leap years have 366 days; all other years have 365 days. 2024 is a leap year.
In this example, I adjusted the dates for 2024 and 2025, so now each year is 365 days long. Now XNPV matches the yearly totals.
This shows how XNPV can show different (and more accurate) results for cash flows that are just one day different. More importantly, your projection is likely a series of months (rather than years) whose dates range from 28-31 days. XNPV is more accurate in this situation.
The accuracy of XPNV increases compared to NPV as the difference in the number of days in each period increases. You will want to use XNPV if your cash flows have highly irregular timing.
Internal Rate of Return (IRR)
The questions you may answer with IRR are:
- Does this investment meet my minimum acceptable rate of return (i.e., hurdle rate)
- Do I have other investments with a better IRR that I should invest in?
The internal rate of return, or IRR, is the discount rate for the cash flows on an investment to equal the initial investment. You could think of it as the yield or return on your investment. The question you want to ask is whether the IRR is higher than the yields on other investment options you have.
Using Excel’s IRR Function
The Excel formula for IRR is fairly simple: =IRR(series of values)
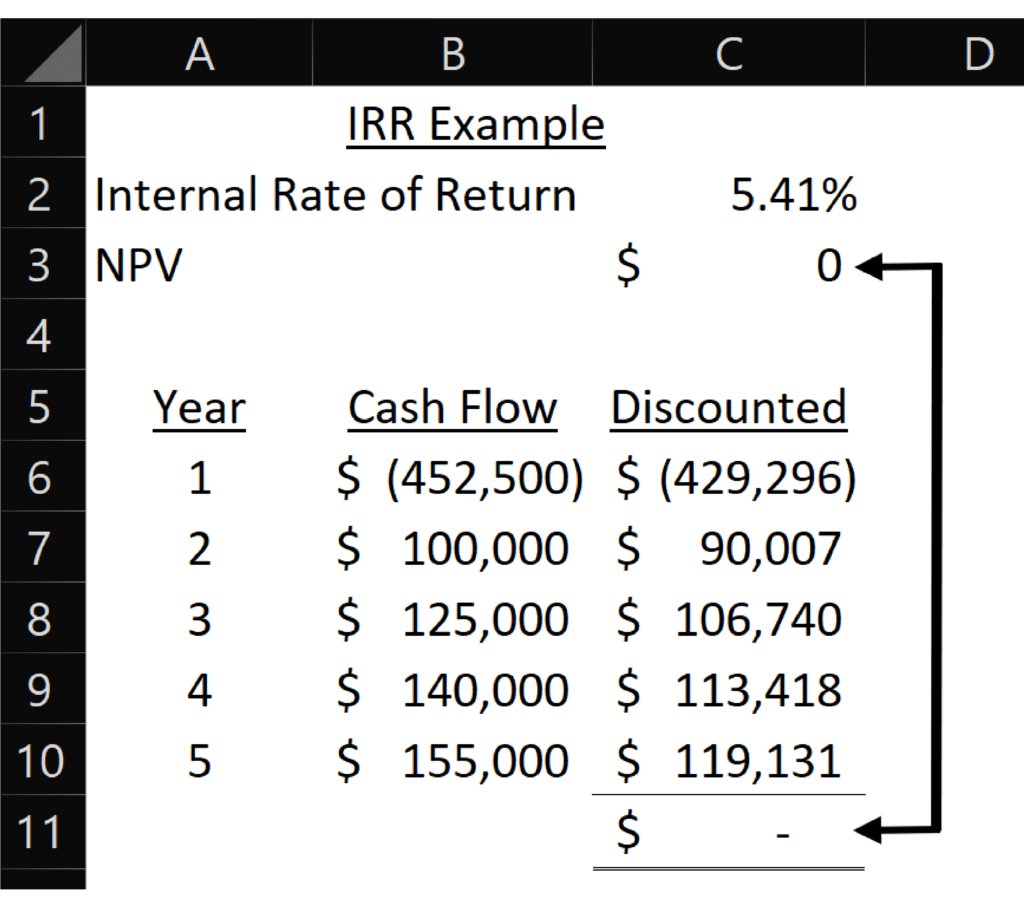
The formula for IRR in cell C2 is: =IRR(B6:B10). Like NPV, Excel assumes cash flows occur at the end of each period.
This table shows the year of the cash flows and their discounted values at the IRR. Notice that the sum of the discounted cash flows equals zero when you use the IRR as the discount rate.
Like NPV, IRR can change based on how many years you project. I only projected five years in this analysis. If I projected two more years of $155,000 of cash flow, the IRR would jump to 19%.
Using Excel’s XIRR Function
XIRR returns the internal rate of return for a series of cash flows where you provide both the timing of the cash flows and their amounts. This will provide a more accurate result, especially if your cash flows rise and fall at different times. You likely are projecting both the dates (e.g., months) and the cash flow amounts, so this is the better formula if you have that data for the formula.
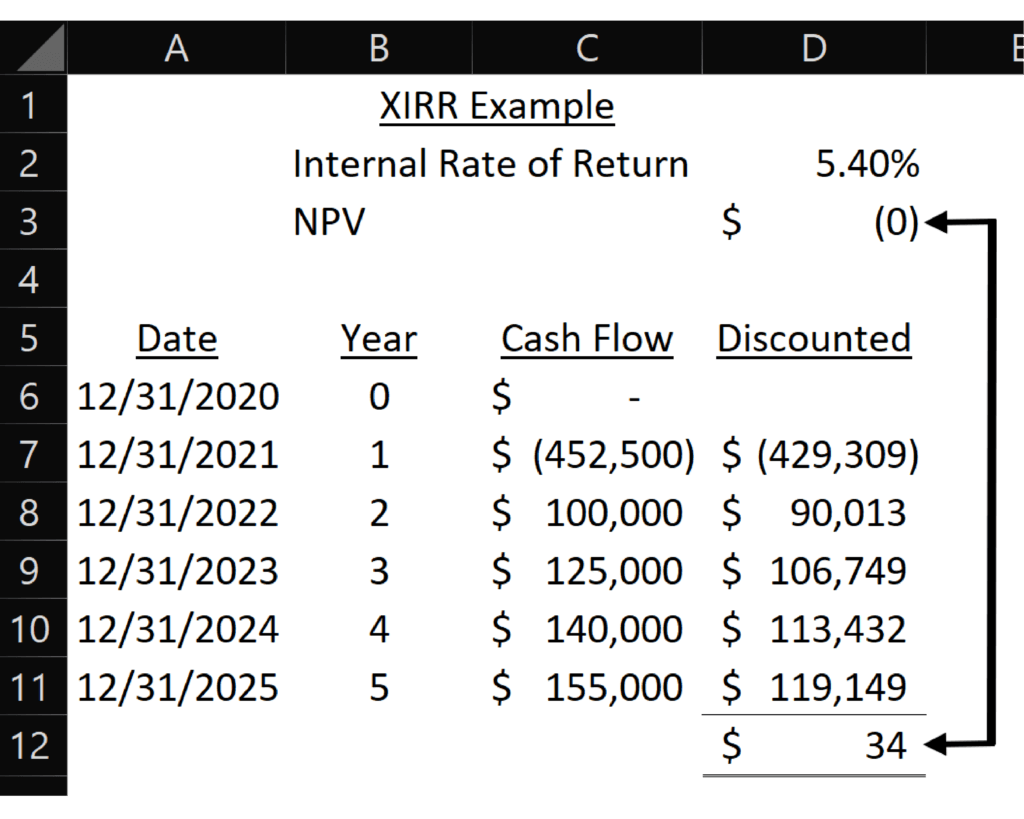
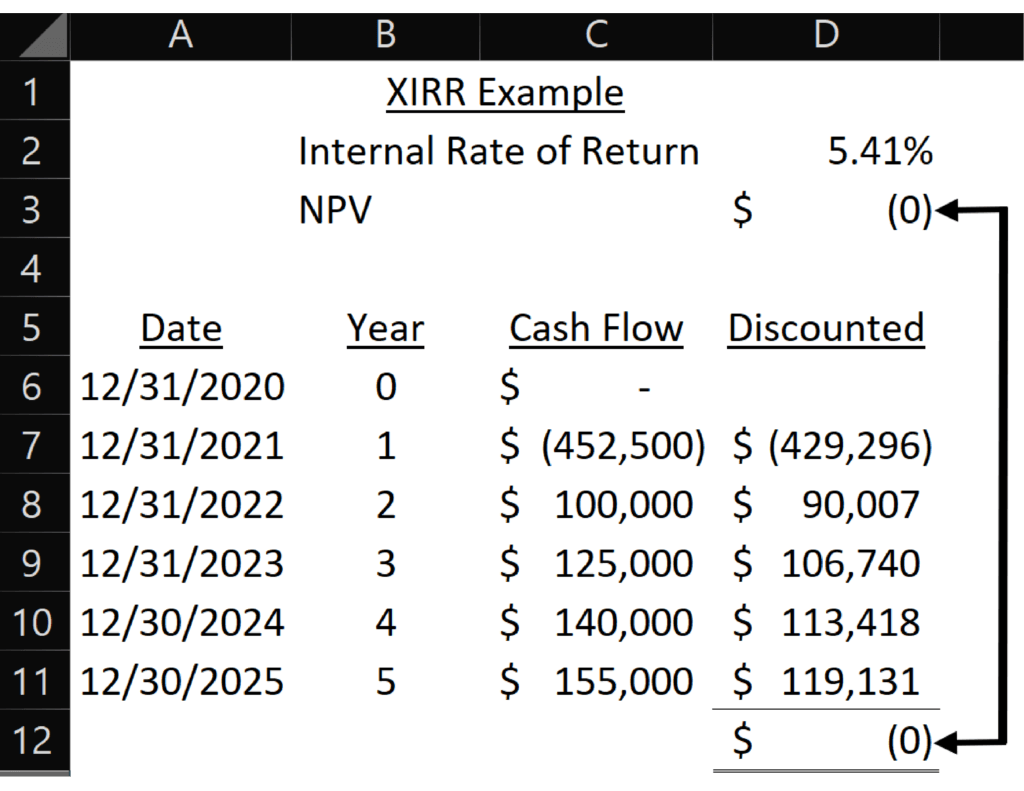
The formula for XIRR is =XIRR(Series of Values, Dates for Values). The formula for XIRR in cell D2 is: =XIRR(C7:C11,A7:A11).
I set up this to match the IRR example, so the dates occur at the end of each year. Once again, this creates a small difference between the annual discounted cash flows (using the equal length of time assumption) and XIRR.
I adjusted the dates as I did for XNPV to show that XIRR will match the sum of the yearly cash flows when every time period is the same length.
Like XNPV, XIRR the accuracy of XIRR increases compared to IRR as the difference in the number of days in each period increases. You will want to use XIRR if your cash flows have highly irregular timing. Using XIRR instead of IRR is very easy if you already have dates in your projection.
Time to Break Even
Time to Break Even answers:
- Can I wait this long until the location starts adding cash to the company?
- How long until the company is better off financially because I opened this location?
A shorter time to break even may also indicate less risk. Your ability to accurately predict cash flows diminishes as the projection horizon increases.
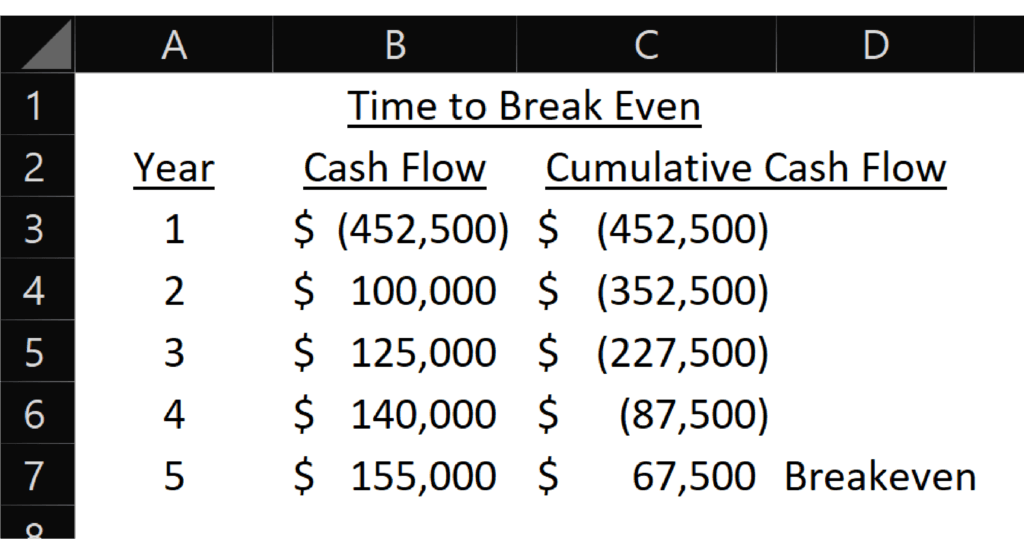
The time to break even is the number of months or years until the cumulative cash flows from the new location rise above zero. It’s when your initial investment is finally paid back.
The benefit of this is that it’s much easier to understand than NPV or IRR. On the other hand, it’s harder to judge the return of the location and compare its profitability to other projects.
Here’s an example of the time to break even. The breakeven occurs sometime in year 5.
You can perform this on cash flows or profit amounts.
Which Metric is Best?
Which metric is best? There is rarely one number that tells you everything to make a decision. Each of these metrics helps you analyze an investment from a different perspective. Your company and industry metrics add further perspectives and points of comparison.
Metrics do help condense all the assumptions and projections into yes/no questions.
- Is NPV positive?
- Is the IRR above an acceptable return rate?
Your analysis will be challenged by people who don’t like the answers to these questions. If they can’t discredit the assumptions and analysis, they’ll point to qualitative factors that “you can’t measure” or “you aren’t considering.”
I created a loan pricing system for a bank. Loans had to meet a hurdle rate of return. If they didn’t, the joke was that the loan officer would say, “But this customer is a great referral source.”
It’s true that not everything can be measured. If the decision is financial, those qualitative factors eventually need to produce cash flows. You will need to arrive at some estimate or range of estimates for the future cash flows of the qualitative factors so they can be added to the analysis.
The qualitative factors may fulfill some other non-financial purpose of the company. For example, the location may benefit an underserved population that the owners want to serve. In that case, you’ll need to weigh the financial results of the analysis with the non-financial benefits.
The examples above all came from my Adding New Locations course. Check it out to get step-by-step guidance on how to decide whether a new location will increase profits or destroy value.
For more info, check out these topics pages: