Scenarios allow you to vary more than two variables when modeling profitability. I’ll walk you through two ways to create scenarios in Excel.
Choosing Scenarios from a Table
You can create a table of scenarios and then use Excel formulas to quickly change between scenarios. The first two columns of the screenshot below use the CVP formula of (# Units Sold X Price) – (# Units Sold X Expense) – Fixed Costs = Profit to calculate profit. I show the CVP formula (cell B8) in cell C8.
Rows D to F have three different scenarios. For each scenario, I list the name, revenue per unit, variable cost per unit, and number of units sold. The number of each scenario is in cells D2 to F2. The spreadsheet user enters a number in cell B2 to select the scenario numbers to use in column B. I show the formula for cells B3 to B6 in cells C3 to C6. I used Excel’s INDEX function in these cells to select the appropriate scenario values.
The formula in cell B2 (shown in cell C3) to find the scenario name can be explained like this: Look in cells D2 to F6 and select the data in the second row for the column number that matches cell B2. The only number that changes from B3 to B6 is the row number from which the formula gets data.
There are multiple ways to create the formula to get data from the scenario table. You could use XLOOKUP, HLOOKUP, and CHOOSE. Excel pros seem to have strong opinions about which formula is the better one to use. I leave it up to your personal preferences.
Scenario Manager
Excel’s Scenario Manager functionality provides a guided workflow for creating and saving scenarios.
Scenarios in Scenario Manager are associated with each sheet. In other words, you can only model changes to variables in that sheet and run summary reports of the impacts on output cells on that sheet. This may be clearer as we walk through an example.
To access Scenario Manager, select the Data ribbon, click on What-If Analysis, and then Scenario Manager.
This brings up the Scenario Manager dialog box. Click “Add…” to create a new scenario. The first scenario I always create is called Base Case. This allows me to return to my original forecast no matter what other scenarios I run. I call this scenario Base Case. You then specify which cells will be changed for the scenario, which are cells H8 to N8 for this example. Finally, you can add a comment about the scenario. This is very useful for documenting what you’re trying to model via the scenario. It’s a big help if you come back to this workbook later and try to remember what each of the scenarios was supposed to show.
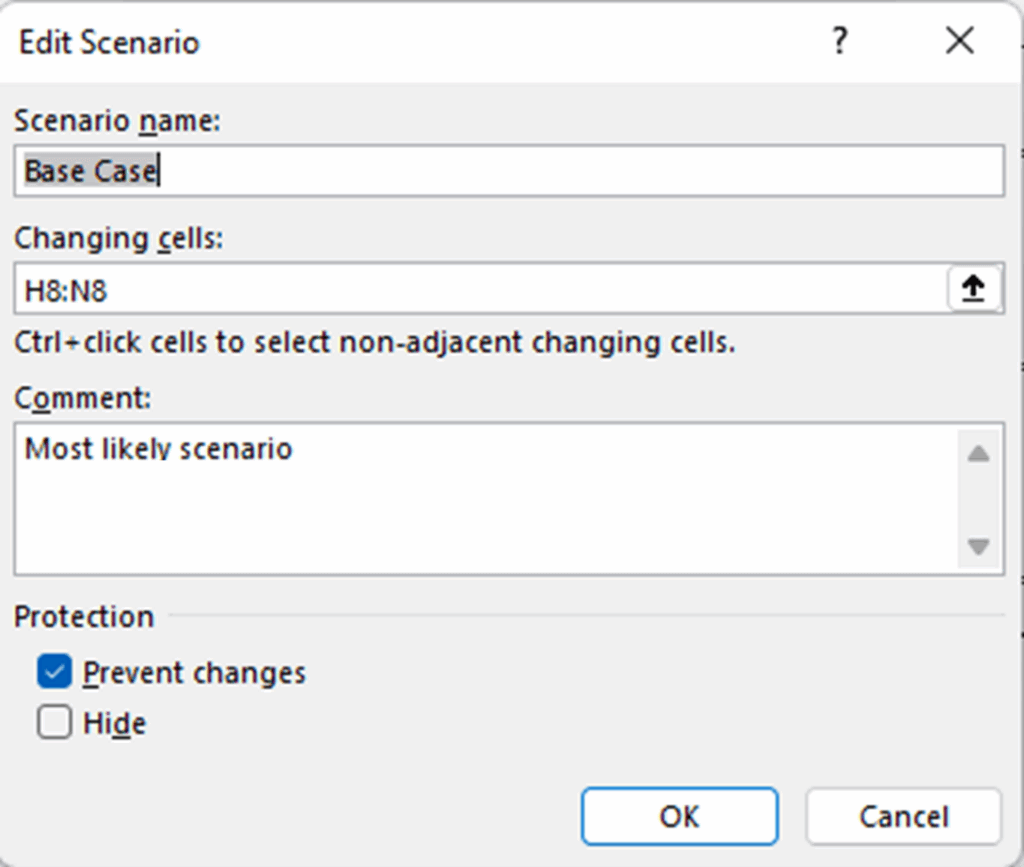
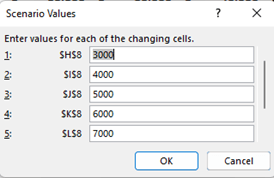
When you select cells, you may also want to select a cell that has a scenario title in it. You can then enter the title for each scenario in the Scenario Values box so that the title in the worksheet is automatically updated when you switch between scenarios.
You’re then taken to the Scenario Values box. Here is where you enter the values for the cells selected in the last screen. Click OK and then Show or Close on the next screen to get to the workbook again. The workbook now reflects the scenario values.
You may want to show the difference between the outcome or profit amounts of different scenarios. Scenario Manager has a summary function for this. One of its limitations is that you can only show the impact on numbers that are on the same worksheet as the scenario values being changed. One way to get around this is to link to numbers you want on other pages.
To build a summary, go to Scenario Manager and then click the Summary button. You have the option for the summary report to be a regular worksheet or a pivot table. I’m just creating a regular report, so I kept the selection on Scenario Summary. Next, select the results you want to compare. In this case, I want to look at the changes to the profit amounts on a worksheet, which are in cells H32 to N32. Click OK, and the report is created.
We now have a very useful report that summarizes the base case and the high-growth scenario. You can use this to review the comparisons and impact on profit. I created a column to the right of the table that shows the difference in sales units and profit amounts. The summary table uses the cell numbers as row names. You can create a column with the labels for those or name the cells.
Scenario Tables or Scenario Manager?
Which is the better method? Excel pros may prefer to set up the table. The table quickly shows the different variables for each scenario. All you need to do to switch scenarios is change one cell.
Scenario Manager provides a more guided workflow than creating your own formulas. Changing scenarios is a little more work than a table, but the comment section of the Scenario Manager dialog box can provide a lot of information about each scenario as you pick from them. The Scenario Summary report is also very useful for quickly comparing scenarios. A similar report can be created with tables by running each scenario and then saving the results. You may want to note in one of the cells of the workbook that there are alternate scenarios saved in Scenario Manager. Future workbook users may not know there are other scenarios hidden in the Scenario Manager.
For more info, check out these topics pages: