The financial goal of pricing is to increase profits, not sales. This seems so obvious when I say it, but many pricing mistakes increase sales but hurt profits.
Sales are so much more tangible and compelling than profit. The sales price of the deal is on the invoice or receipt; the profit of a single transaction is rarely calculated. “Getting the deal” or “making the sale” is often seen as a win. We beat the competition. Many compensation systems reward sales volume, not profit. Sales mean dollars in employee pockets.
The underlying assumption is that more sales lead to more profits. This assumption is more often false than many believe. Increased sales volumes can trigger more costs than anticipated. I’ll show some examples of how this occurs.
Marginal Contribution
First, let’s clarify which numbers are relevant when we talk about increasing profit. What we really want to maximize with pricing is marginal contribution. “Marginal” means the change in something. “Contribution” is the revenue from a transaction minus marginal costs. The transaction “contributes” margin to the company for covering fixed costs.
Here’s an example of a marginal contribution calculation. Let’s say you currently sell your product for $30. Some employees say that cutting your price by 10% will increase sales by 10%. Will that increase profits? Let’s walk through an analysis. The assumptions are on the top half, and the calculations are at the bottom.
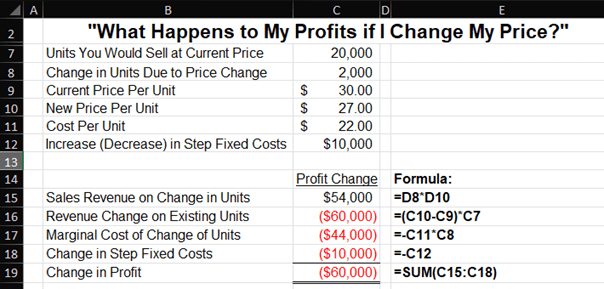
The analysis starts with the current volume of 20,000 units. The price decrease increases sales by 2,000 units. Your current price is $30, so a 10% decrease means a new price of $27.
Let’s assume that your marginal cost per unit is $22. It’s important to use marginal costs in this analysis. I’ll explain more about this later.
I also added an increase in step costs. A step cost is a cost that stays fixed over a range of production but then shifts to another level of fixed cost when production goes above or below that range. That shift can be significant. Examples are new equipment or employees. They may be “direct” or “overhead” costs. You may need a new production employee, manager, or administration employee. My example of $10,000 is much lower than most step costs.
Increases in sales and production can trigger a step cost because capacity limits are exceeded anywhere in the company. It’s rarely discovered for an individual transaction. It’s better anticipated during budgeting. It may not be discovered until a manager talks about how their staff are “burnt out” or when people leave. I talk more about this in my budgeting courses. Companies can die from a thousand cuts, and they can also die from a thousand increases (of costs).
We can now walk through the calculations. The increase in sales of $54,000 is the $27 per unit price times 2,000 additional units.
The revenue change represents price cannibalization. Price cannibalization is the loss of sales at one price to sales of the same product at a lower price. Many businesses have one price that’s listed for all customers. Cannibalization then occurs across all existing sales, as shown in this example. It’s calculated as the difference between the new price and the old price multiplied by all your existing sales units.
Cannibalization can occur even when you quote unique prices to each customer. Customers talk to each other. A customer who receives a good price one time will want that price the next time. It’s hard to increase prices once a customer anchors on a lower price.
The marginal cost increase from the change in units is the 2,000-unit sales increase times the $22 cost per unit. This equals $44,000.
The last component is the increase in step costs.
The total of all the components in the change of marginal contribution is -$60,000. What are some ways to mitigate this loss?
- Reducing cannibalization can save you up to $60,000. You could sell the new product to a new market or customer that doesn’t impact pricing on your existing customers and markets.
- There’s a chance that increasing production could reduce our marginal cost per unit and the costs of all the existing units. For example, buying inventory in larger quantities might lead to a price break from your supplier.
- You won’t have a step cost if you have excess capacity in all resources used by this product.
Price Cannibalization
Price cannibalization can have a massive impact on marginal contribution from price changes. The worksheet I showed earlier assumes cannibalization across all existing sales (i.e., 100% price cannibalization) for simplicity. As I noted earlier, cannibalization may be lower than that when prices are quoted to customers rather than listed for all customers.
You can do a sensitivity analysis of price cannibalization to marginal contribution. The table below shows different changes in contribution at varying levels of cannibalization using the assumptions in the earlier analysis.

Irrelevant Costs
I noted that the relevant costs for the pricing analysis are marginal costs. Many people in a company think the per-unit cost is an average cost or standard cost. Finance staff likely create cost or profit reports for many managers that show these per-unit costs. These costs may even be derived from activity-based costs (ABC), which is more accurate than traditional costing methods.
There are some problems with using these costs for pricing decisions.
- All decisions are about the future. The cost numbers I just mentioned are past costs. Future costs may be very different than past costs.
- They often contain fixed costs. Once again, decisions are about the future. Past costs are sunk costs that are irrelevant to the future. You should set prices to maximize future profit (i.e., marginal contribution) whether you have $1 or $1 billion of past costs. Raising prices to “cover overhead” will reduce sales and may reduce profits. Reducing prices to sell more units to “cover overhead” may lead to the drop in marginal contribution I showed earlier.
Imagine two scenarios. In both scenarios, revenue per unit is $500, and variable costs are $100 per unit. For simplicity, we’ll assume that variable costs are also marginal costs. Fixed costs are $10,000 in both scenarios. Following is a financial summary for a scenario at ten units and at 100 units.
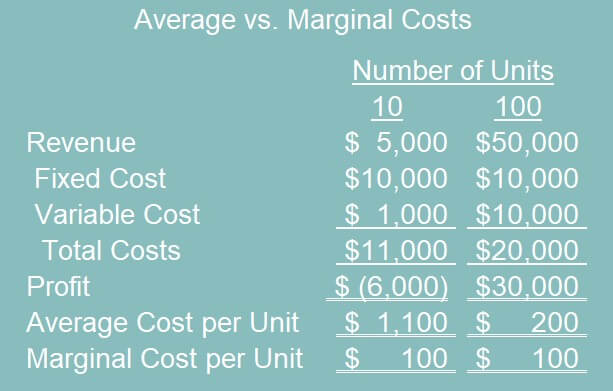
The marginal cost per unit is $100. The average cost per unit is $1,100 for ten units and $200 for 100 units. Average costs are constantly moving with volumes, while marginal costs are more stable.
Imagine a business leader had the chance to sell their product for $150 (with no impact on existing customers) and came to Finance to ask what the product costs are so the leader knows whether they will make a profit. What will you tell them? “Well, it was $1,100, but now it’s $200.” They would struggle to understand how producing the same product could have costs that range from $200 to over five times that amount. To a backward-looking accountant, this makes total sense. To a forward-thinking salesperson, it’s useless. The average costs with fixed costs might convince the leader not to make the sale, even though it would have a positive marginal contribution to profit.
What about covering future overhead? More costs become marginal costs the further you look into the future. Maybe a way to think about this is via zero-based budgeting. Ignore what currently exists and how you’ve “always done it.” You always have the choice to rebuild your company and its cost structure, given enough time to implement the rebuild. All costs – variable costs, step costs, and fixed costs – are marginal costs in that scenario.
Planning lies between a short-term world where only variable costs are relevant and an extremely long-term view where all costs are marginal. Strategic pricing for the long term would include some step costs and fixed costs that will be incurred in the future. The sum of the future marginal contribution of all products and customers must be positive for your company to be profitable.
So, pricing does need to cover overhead when it’s a relevant marginal cost.
An Example of Relevant Step Costs
I ran into the example I’m about to show you by pure dumb luck when teaching an Entrepreneurial Finance class to MBA students. I had created a scenario for a simple pricing exercise to be completed by groups in class. Two groups came up with different answers. The more I thought about it, the more I realized they could both be correct. Don’t tell my students that they were the ones that led me to this insight. I have a professorial reputation to protect.
Here’s the scenario I gave them:
You are currently selling 50,000 sprockets a year at $40 per sprocket. Your sales staff says they could sell 10,000 more sprockets if you lowered the price by 5%. They say you could get a 20% increase in sales for only a 5% decrease in price. The marginal variable cost per unit is $25 for the new volume. You have no excess capacity, so you’ll also need to buy a piece of equipment that costs $45,000 and will last three years.
Here’s an example of a solution:
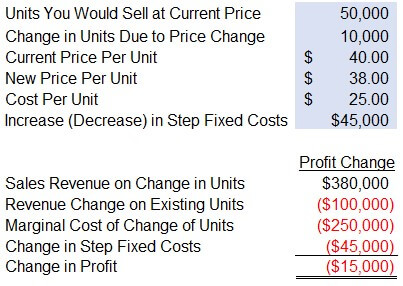
I went through this analysis earlier, so I won’t go through the calculations again. The interesting question is what number should go in the change in fixed costs. The full $45,000 is a future cost, so there’s a case that the full amount should go into the analysis.
Accounting types may have already built an amortization table in their heads and said that only $15,000 of the $45,000 is relevant since that’s one year’s worth of amortization. If you make that assumption, then the change in profit improves to a positive $15,000.
Here’s the point. The relevant costs are based on your assumptions. The full amount of the step cost is relevant to this transaction if the step cost of the machine has no other use in the future. However, part of the cost may be applicable to future additional volumes or to other future volume. If that is the case, the part of the costs applicable to other sales and the revenue from those sales are aspects of future marginal contribution.
Thinking Long Term
A common complaint about financial staff is that they don’t see the “big picture.” The argument is that financial analysis can focus too much on a transaction or product, but sales staff know that a low-margin deal can bring future profitable business.
It’s true that a full financial picture needs to consider both the costs and revenues from ancillary services to a product. You may want to measure the lifetime customer value of customers who use this product rather than product profitability. In this case, you’re optimizing for customer profitability, not product profitability.
I once created a customer profitability modeling system at a bank. Sometimes, business loan officers would model the customer and get results that they didn’t like. Their last-ditch effort to justify the deal was “the customer is a great referral source.” In that case, model what business they expect to be referred but realize that there is far from a 100% certainty of future high margins to justify today’s low margin from this customer.
Incentive Compensation as a Relevant Cost Feedback Loop
Low-margin deals face further profitability headwinds due to incentive compensation. A person or team may want tight margins to achieve a compensation goal for the year. This might cause a huge jump in incentive compensation costs if they achieve the goal. If so, that jump in costs is a marginal cost that must be considered. To not acknowledge its cost is fooling yourself.
The benefit of the team achieving the goal is partially a political and employee satisfaction cost that managers must weigh. Once again, it kicks off another consideration of costs from employee turnover or low morale from not hitting goals.
What we see is that there are layers of subjective customer satisfaction and employee satisfaction that must be weighed. It may be possible to measure the financial implications of these subjective items and include them in marginal profitability.
Maximizing Marginal Contribution
The examples so far have assumed a price and volume to arrive at profit. We could do that over and over again to find the mix of price and volume that gives us the highest profit. There may be a faster way.
Marginal contribution is maximized when marginal revenues equal marginal costs. I’ll first show this in a table.
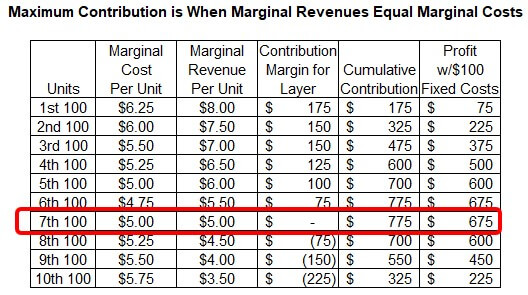
In this example, the first 100 units are sold for $8.00 per unit with a cost of $6.25 per unit for a contribution of $175. The next 100 units are sold for $7.50 per unit with a cost of $6.00 per unit for a contribution of $150 for that layer. The total cumulative contribution for the first two layers is $175 + $150 = $325.
Notice that the cumulative contribution peaks when marginal costs are $5.00 and marginal revenue is $5.00. Not surprisingly, the marginal contribution for this layer is $0. Marginal contribution and cumulative contribution both decrease after the 7th layer. You may notice that the cumulative contribution was also $775 after the 6th layer. It may be more precise to say:
- Cumulative contribution increases when marginal costs are less than marginal revenue.
- Cumulative contribution does not change when marginal costs equal marginal revenue.
- Cumulative contribution decreases when marginal costs are greater than marginal revenue.
The far-right column shows how fixed costs are irrelevant to setting the profit-maximizing price. That column is calculated as the cumulative contribution minus fixed costs. Note that profit peaks in the right column at the same point where marginal contribution peaks.
The cost per unit decreases from layers 1-6 and then starts to increase. You have probably heard about economies of scale. This theory states that costs per unit go down for a time as more units are produced. At some point, marginal and average costs also rise, which is called diseconomies of scale.
Let’s now look at all these concepts in a graph. The lines on this graph are not drawn from the preceding table but share the same concepts.
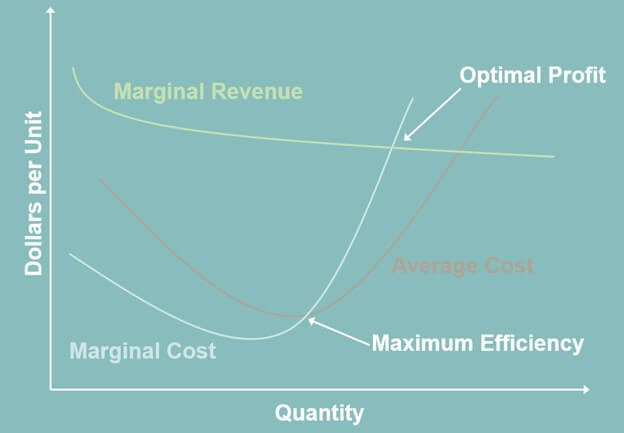
The vertical axis is the dollars per unit. The horizontal axis is the number of units. Marginal revenue per unit is green, marginal cost per unit is grey, and the average cost per unit is brown.
Maximum efficiency is when your marginal costs cross average costs as they rise upward from diseconomies of scale. Marginal costs always start rising before average costs. If you only looked at costs, you might think this is the sweet spot for production and sales.
The highest cumulative margin occurs at a higher quantity, where marginal revenue equals marginal costs. You would optimize sales and production planning for this point. In this example, you would stop production at a volume that’s less than when average costs cross marginal revenue.
Pricing Flexibility from High Margins
High margins at current market prices provide companies with a great deal of pricing flexibility. Increased sales volume comes with high marginal profitability. If competitors cut prices, a company with high margins can match the cut while still making positive margins, albeit lower than what they were making. High per-unit margins also signal that cumulative margin optimization may be at lower prices and higher volumes than the company is currently experiencing.
For more info, check out these topics pages: