The Working Capital Ratio
Net working capital is current assets minus current liabilities. The working capital ratio uses the same components but is calculated as current assets divided by current liabilities. Below is an example calculation.
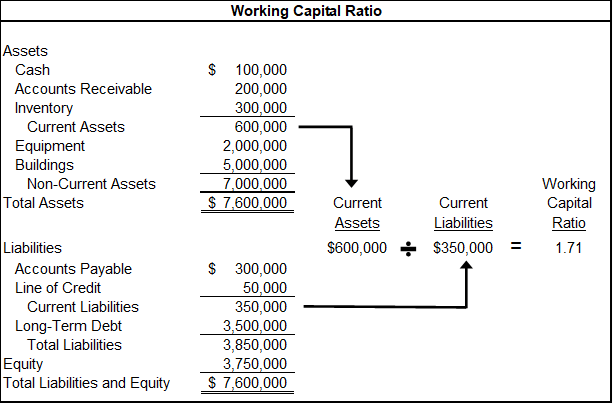
This ratio is much more useful for some analysis than the dollar amount of net working capital. If I told you that a company’s net working capital was $100,000, it doesn’t tell you much. It would be huge if the company’s liabilities were $10,000, and it would be tiny if they were $10 million. You couldn’t easily compare the company’s working capital level to other companies for reasonableness.
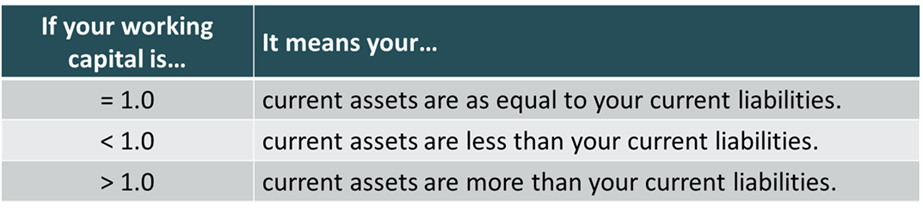
If I tell you a company’s ratio, you instantly know something very important based on whether it’s below or above 1.0. If it’s below one, the company’s current assets are less than the company’s liabilities, so it may not have enough cash to cover everything it needs to pay in the next year. If it’s greater than one, it’s more likely that the company will have the cash to cover the liabilities.
Quick Ratio
The quick ratio is also known as the acid test ratio. Frankly, that’s an extreme title for an accounting metric, but it sounds cool. It’s calculated as current assets (less inventory, prepaid expenses, and supplies) divided by current liabilities. This ratio removes some illiquid assets and is a tougher test of your cash flows than the current ratio.
Like the current ratio, higher is better from a cash flow perspective. A common recommendation is for this to be equal to one or higher.
Let’s return to the example balance sheet to look at its quick ratio.
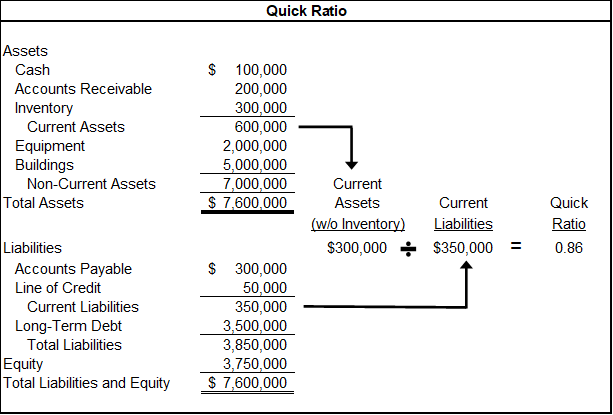
Their total current assets are $600,000. For the quick ratio, you take out $300,000 of inventory, leaving $300,000. That’s divided by the current liabilities of $350,000 for a quick ratio of .86. As mentioned earlier, a common recommendation is for this to be equal to one or higher.
Turnover Ratios
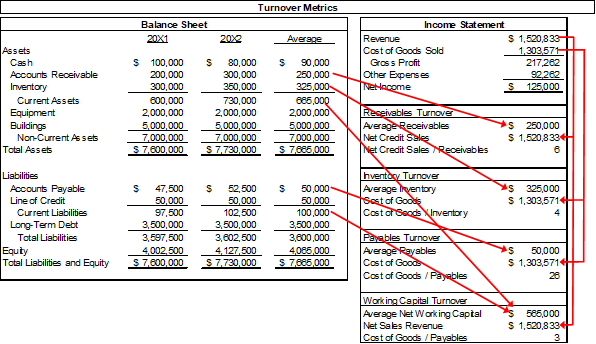
The turnover ratios express A/R, inventory, and A/P divided into their related income statement accounts. A turnover ratio measures how many times per year you complete each stage of the cycle. Below is a table that shows the ratio calculation. The table also shows whether a higher ratio is generally good or bad.
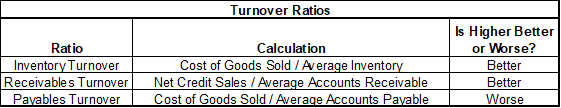
If your cost of goods is stable while inventory is shrinking, then the inventory turnover ratio goes up because the denominator is dropping. You free up cash that was trapped in inventory.
There is also a working capital turnover ratio that is calculated as net sales revenue (i.e., net of returns and discounts) divided by net working capital. A higher working capital ratio is generally better. Below are the calculations of the turnover ratios using the example balance sheet and income statement from an earlier lesson.
Tracking Trends
Ratios and trends allow you to track your company’s progress over time. You can see if your working capital days are getting shorter and if your working capital turnover is going higher. An increasing working capital ratio may mean you are reducing your liquidity risk or that you have an inefficient rise in inventories or receivables. The working capital metrics must be looked at together to tell the complete story. Ultimately, effective working capital management should lead to better cash flow and increased profits.
Assessing Performance Relative to Peers
One way a company can evaluate the effectiveness of its working capital management is to compare its working capital metrics to those of its competitors. Balance sheets vary greatly between industries. The metric amounts of effective working capital management are different for each industry. They can also vary over time due to economic conditions.
It may also be useful to compare common-size balance sheets. A common-size balance sheet expresses each line item as a percentage of total assets. A company can compare its receivables as a percentage of assets compared to the industry average.
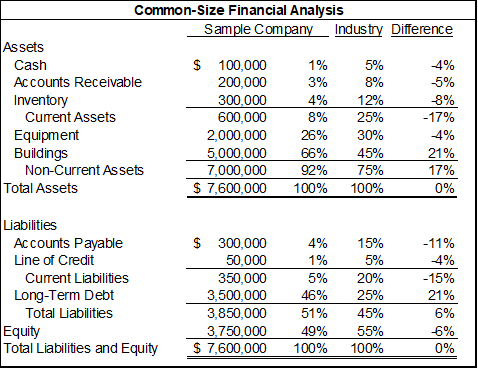
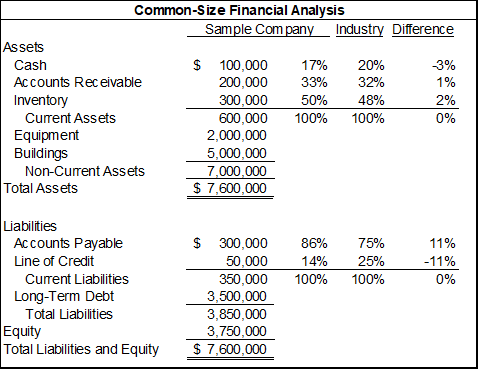
A variation of this is to compare individual current assets as a percentage of total current assets compared to the industry average. The same could be done for current liabilities. This is useful when peer companies have large differences in non-current accounts that obscure the working capital analysis we saw above.
Some sources for common-size financial information include:
- Industry Reports: You can buy industry reports that contain qualitative and quantitative analyses of an industry. That quantitative analysis often includes common-size financial statements. These reports can be specific to industry segments, company size, and location.
- Investment Reports: Investment reports on a company’s stock may include common-size financial statements for that company. It may also compare the company to common-size financial statements of its competitors or industry.
- Databases: Some companies offer databases of financial information, which may include common-size financial reports for companies and industries. The beauty of databases is that a custom peer group can be easily built based on a wide variety of criteria. The criteria could be company size, location, years in business, etc.
Please check out my course on common-size financial analysis for more information.
Working capital surveys are another good source of information on working capital trends. Multiple companies provide these. You can do an internet search for the term “working capital survey” to see the options. These provide analysis and commentary specific to working capital trends.
A Note About Generalizations
Imagine I offered you a free vacation and then dropped you into Antarctica. You would probably say you prefer something warmer. I then overcorrected and transferred you to the sweltering heat of Death Valley, California. Like Goldilocks, you favor something that is not too cold and not too hot.
In this course, I often say whether higher or lower is generally better for metrics. I mentioned earlier in this course that the optimal target for your working capital is within a range. This is true for both dollar amounts and metrics. Higher or lower isn’t always better or worse.
A lower days sales outstanding amount is generally better. However, extremely low levels can be caused by an extremely strict credit policy that limits sales. Low receivables may also be a sign of an extremely generous discount policy that hurts profits.
On the other side of the balance sheet, a higher days payable outstanding amount is generally good. However, this can be taken too far when a company incurs late fees, hurts its credit score, and angers vendors.
For more info, check out these topics pages: