Not all leads become customers. Customers often don’t buy from the first contact with you. The concept of a customer journey highlights that a lead takes many steps over time to become a customer. The concept of a sales funnel highlights that only a fraction of leads become customers.
Let’s look at a sales funnel example that also shows a customer journey. The Digital Insurance Policy Company (a fictional example company) uses search engine advertising (SEA) to get leads.
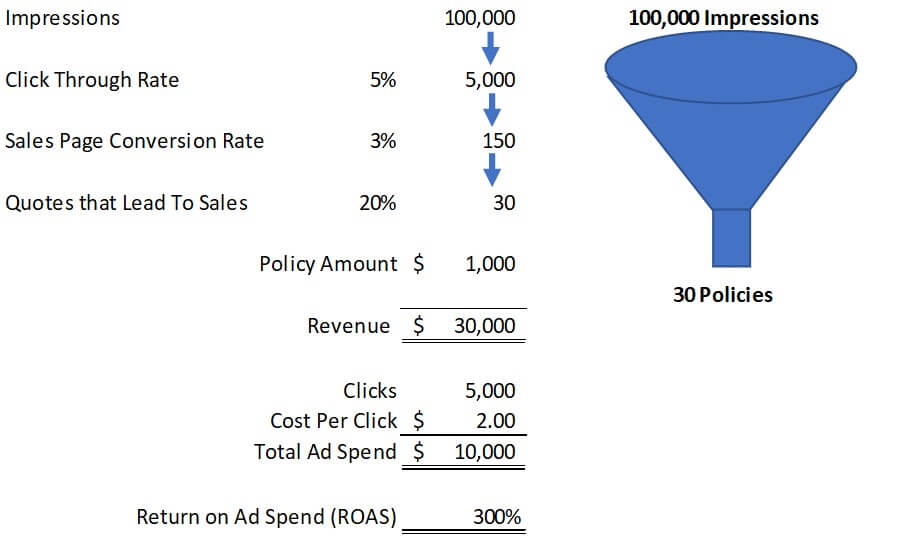
- For every 100 times they show up in a search, 5 of those people click their ad.
- When they click the ad, they are taken to a sales page. That page talks about Digital’s great rates and asks the person to fill out some information for an insurance quote. Only 3% of the people who see the sales page enter information for the quote.
- Of those who get a quote, 20% buy insurance with an average policy amount of $1,000.
This shows how many assumptions are made in the customer funnel before we can even get to the units (i.e., policies) sold. Each of these assumptions will have to be developed over time during ad campaigns. Lacking that historical data, they would have to use industry average data. All of these rates can be modeled at different rates for scenario or sensitivity testing.
Digital Insurance could set its target revenue and then back into how much it would have to spend in SEA to get that revenue. This would be using a revenue budget to set the marketing budget.
They may decide they only have $5,000 to spend on marketing. They could then calculate how much revenue they should expect to make. This is a marketing budget informing the revenue budget.
In this example, the cost per click is $2, so the total ad spend is only $10,000. The return on ad spend (ROAS; i.e., revenue divided by ad spend) is 300%. ROAS may be a key indicator they want to monitor because it sets a major assumption in the budget (e.g., marketing expense or revenue income). If ROAS differs during the year, they can identify which rates in the customer journey differ from their budgeted assumptions.
To learn more about improving your company’s budgeting, check out my Better Budgeting course.
For more info, check out these topics pages: