You don’t need another number. You already have more numbers than you know what to do with. There is so much information coming to you from your business that the key performance indicators that matter most get drowned out in the noise of numbers.
A client showed me their business’s dashboard. I kept scrolling down a page of graphs and numbers. I love numbers but even I was in number-shock. My eyes were glazing over and my mind was getting confused – classic symptoms of number shock. I asked my client what they did with this. They said it’s a bit overwhelming so they didn’t look at it most months. Too much leads to nothing.
It’s time to cut the clutter so you quickly know exactly how you are performing on the key performance indicators (KPIs) of your company’s success.
Benefits of Key Performance Indicators
68% of respondents to a survey stated that using Key Performance Indicators (KPIs) had a positive impact on their organization. Good key performance indicators provide the following benefits:
Communication of the company’s priorities
When everything is a priority, nothing is a priority. KPIs guide the prioritization of scarce resources. People also can’t keep large amounts of metrics in their head, so limiting the number of metrics increases the effectiveness of each metric.
Staff often feel like there their company (or even just their boss!) is giving them so many conflicting priorities. Is the priority today good service or is it saving costs? The key metrics help them sort out the priorities. At the same time, it helps communicate the values the company wants the staff to be aware of and reflect.
KPIs take strategies that were developed by management and allows everyone to own them and recognize their progress. Making something a priority declares what will be secondary when two goals conflict.
What we measure is a way to communicate priorities and values. For example:
- A company that’s prioritizing profitability may focus on net income or return on equity.
- A company focused on efficiency would focus on a metric like cost per unit.
- A company whose priority is customer service might use a metric of customer satisfaction scores.
- A company that wants to show how they value their employees may monitor the development hours of their staff or their staff turnover ratios.
- A company that values community involvement may measure the volunteer hours of their staff.
The metrics allow periodic refocus on the main things and not become too distracted. The main thing is to keep the main thing the main thing.
Over the years, I’ve seen lots of measurements. A company will change metrics year-to-year as the priorities change. Even if the strategy of the company doesn’t change, what’s measured focuses the company on areas of the strategy that need more focus at a particular time to achieve the desired goals.
Clear definitions of success
Measurement allows an objective definition of success. How do we know if we are doing good enough or need to do more? How do we know we are accomplishing our goals?
Without measurements, everyone would have their own interpretation and be able to justify their effectiveness, even when they have a very weak argument. Everyone in the company may agree that “being the leader in our market” may be the goal but differ on what exactly constitutes success. Is it the highest customer satisfaction, largest market share, or highest profitability?
Measurements clarify expectations for everyone of what acceptable and what constitutes success. The KPIs set out the company’s decision on the best way to measure effectiveness.
Motivation
Most people are driven by finding purpose in their work and a desire to succeed. The KPIs provide clear and constant feedback on progress towards the goals.
Continuous feedback for rapid adjustments
You want to learn quickly if your plan and tactics are going to accomplish your goal so you don’t waste time and resources. Strategies, goals, and plans are also not always perfect, and the feedback informs improvements to them.
Accountability
As the saying goes, “What gets measured gets managed.” The commitment of the company to elevating certain metrics as key performance indicators means these are critical to success so action must be taken when a metric is not being achieved.
And Now The Elephant in the Room…

A common benefit that’s mentioned for KPIs is that they can be used for incentive systems. Should you tie incentive compensation to your key metrics? No. Incentive systems can hurt more than help.
The effectiveness of KPIs is stunted by gamesmanship and sandbagging when directly tied to compensation. Compensation should certainly be tied to performance, but that performance is much broader than most individual organizational KPIs.
Key Performance Metrics and Targets
Goals are measurable when they have at least one objective metric. Metrics monitor the outcomes from tasks, not the completion of tasks. Deadlines monitor task completion. For example, let’s say you have a goal of increasing customer satisfaction. Your customers will be more satisfied if they receive their products in two days. Here are examples of deadlines and metrics:
- Design the process to more quickly deliver the product to the shipping company: This a deadline and not a metric. If you are uncertain that the process consistently ships more quickly you could monitor it as a metric.
- The customer receives the product in two days: This is the outcome of delivering to the shipping company more quickly but the actual day the customer receives the product is not in your hands. You must measure the arrival data to make sure you achieved an outcome that’s critical to your customer’s satisfaction.
- Customer satisfaction scores: This is the ultimate metric for your goal and you may find that improving the delivery time creates no improvement to your customer’s satisfaction.
Metrics are what you are measuring, and targets are the metric value that you are trying to achieve. In the example above, if you measure customer satisfaction with a five-star rating system then a target would be an average rating of 4.5 stars. You may hope to receive all five-star ratings but there are always people who flame you with a one-star rating or who almost never give a perfect five-star rating.
Key Performance Indicators vs Non-Key Metrics
Your first task is to clearly identify your company’s key strategies and goals. There are so many words used in the business press that mean similar things. For this article, strategies are the guiding plans to achieve the mission/vision of your company and goals are the more specific and measurable steps you will take to achieve that strategy.
An acronym that’s often used for goals is SMART. They must be:
- Specific
- Measurable
- Attainable
- Relevant
- Time-based
It’s a key metric if it accurately measures your progress toward achieving a key goal of your business strategy. All other information that’s interesting but not critically important to your success is a non-key metric.
The concept is simple but so many companies blow this first step. What usually sabotages people is lack of clarity and alignment on the key goals.
Everyone may say they agree on the key metrics but there may be other measures that they still cling to as measures of their success. The process of identifying key metrics allows this to be identified and dealt with. When someone elevates something above the company’s clearly identified KPIs, it’s the opportunity for the company to examine that goal and either add it to the key goals or clarify to everyone that it’s not a key goal.
Characteristics of Good Key Performance Indicators
Here are some characteristics of good KPIs:
Clarity

The wording must be clear and everyone must understand what the metric measures, even if they don’t totally understand how to calculate it. It’s not motivational if it’s unclear. It’s not even useful.
Leads to Action
Everyone needs to know how their actions, whether individually or as a group, can help the company meet the company’s goals. The metric has to be quickly translated into an action in everyone’s heads.
Balance of Leading and Lagging Indicators
Leading indicators provide early indications of whether you are on track. Lagging indicators often show the final results of all your work. For example, page visits on your website may be an early indication of future sales but you can’t deposit clicks at the bank. Sales numbers or profitability numbers may show your ultimate performance but may not focus on key drivers of the sales.
The benefit of early indicators is that they can quickly show you if you need to make corrections. A leading metric can show problems within days while a lagging metric may not signal a problem for months.
The benefit of lagging indicators is that they usually are more closely aligned to your ultimate goal and capture broader information.
Minimize Noise
Sometimes something other than the outcome you are trying to monitor will cause a metric to rise or fall. This creates “noise” that distracts from discussions on fundamental performance.
For example, a metric that was tracked at one financial institution I worked at was deposit growth. We started tracking deposit growth monthly and found out that the balances on the last day of the month were strongly influenced by what day of the week the month ended on. This caused us to spend more time in our monthly metric review explaining how the day of the week impacted the metric than our fundamental performance. We then made a small change to the metric to better measure deposit growth and take out that noise.
There is almost always a small amount of noise from sources other than your desired outcome so aim for minimizing noise rather than wasting resources looking for an elusive “perfect” metric. Another mistake is to reduce the noise by making the metric more complicated. As noted above, complicated metrics lack clarity and are less effective.
Limited Number
How many key metrics should there be? This is often hotly debated. I’ve worked at a company that successfully monitored 15 KPIs that were set once a year. In the book “Measure What Matters”, John Doerr advocates setting objectives quarterly with a few metrics for each objective.
Setting metrics more frequently allows the rapid evolution of metrics to match the speed of rapidly evolving markets. On the other hand, the process of setting objectives and metrics is very time-consuming and doing it quarterly takes a strong belief in the return on the time commitment.
Setting KPIs less frequently may allow more metrics to be monitored at once since people have more time to learn them. Frequently changing metrics can also seem frenetic or reactionary to staff, which can cause them to blow off the “metric of the moment”.
I know of a company that moved from annual budgets to setting 12-month projections every quarter. Rather than making employees constantly looking 12 months into the future, it caused them to only focus more closely on just the next quarter. They knew the other three quarters were subject to revision in three months.
The right number for your company is based on how quickly you can develop metrics and communicate them to staff. It should also align with how far out in the future you want staff to be focused on. The longer the timelines, the more metrics you may be able to use.
Stretch Targets
Once again, there is a debate on how aggressively to set the target for each KPI. Some advocate setting metrics where the expectation is that all of them can reasonably be attained. Others advocate setting aggressive stretch goals with the expectation that not all of them will be met but more progress will be made than if the goals had been set lower.
Metrics in Tension
There is a law of unintended consequences that’s similar to the physics law stating every action has an opposite and equal reaction. If the company pushes for growth, quality may suffer. If the company focuses on efficiency, employee morale or customer satisfaction may dip. Both growth and quality are good, but sometimes they are in tension.
Lagging indicators can determine if the trade-offs were made in a way that increased overall profitability or another high-level goal. Another option is to use two metrics that measure opposite aspects of the tension so one isn’t emphasized at the expense of the other.
Measures the Right Thing
It’s more important to roughly monitor the right thing than to accurately measure the wrong thing.
Not everything can be neatly quantified. However, the list of things that can be quantified may be larger than you think. Think hard about how to quantify something.
If it truly can’t be directly quantified, identify outcomes that can be quantified that would indicate success. If all else fails, you may consider the word “assess” instead of “measure.” I’ve used scales of 1-10 or 1-3 or red/yellow/green to subjectively measure some metrics.
Identifying and Setting Key Performance Metrics is Just the Beginning
Sorting through all the potential ways to measure success to find the few most important measures is hard work. Setting appropriate targets for each metric isn’t any easier.
But that’s just the start.
Now it’s time to communicate them throughout the company and set up monitoring systems. Then you will communicate about them to staff again, and again, and again…
One of the best tools for both communicating your metrics and tracking them is a Key Performance Metric Dashboard
Key Performance Metrics Dashboard
A Key Performance Metrics Dashboard of your Key Performance Indicators (KPI) provides clarity and accountability to turn goals into action. You get regular information about whether your company is on track to accomplish its goals. I have more info in a post on the three steps for using a small business KPI dashboard.
I’ve developed an easy-to-use template that will enable you to track your key metrics. It’s included in my KPI Course and available to FAST members. There’s no reason to buy expensive software to track your key metrics. You can create your dashboard in Excel or Google Sheets with this template.
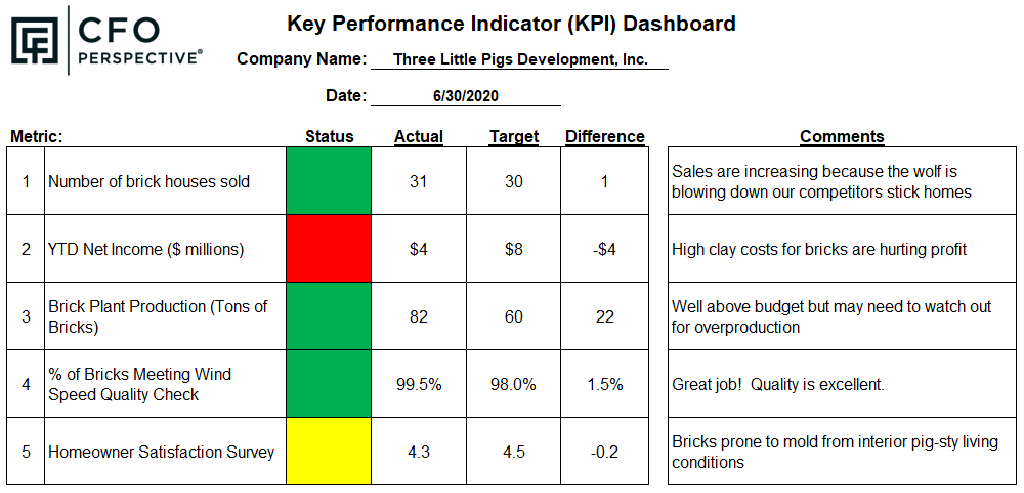
The dashboard tracks both your metrics and their targets. A simple visual indicator of green (good), yellow (slightly below target), and red (well below target) quickly tells you and staff how you are doing on each metric. The dashboard also shows the difference between the YTD target and the year-end target.
Another key component of the dashboard is the comments section. The comments section allows you to communicate the “why” behind the “what” of the metric. You can talk about what’s working and what needs to be done. You can put the metric in the context of challenges in the market.
The dashboard can be emailed to staff or uploaded on a company intranet. You can update it on a monthly or quarterly basis.
Are You Ready to Focus Your Company on Success?
You now know how to cut through the clutter of numbers to find your KPIs. Metrics and a dashboard to monitor them are powerful tools to achieve your goals. You don’t need to build your dashboard from scratch.
I walk you step-by-step through the KPI process and give you resources in my course on Key Performance Indicators (KPIs) and KPI Dashboards.
For more info, check out these topics pages: