You don’t need to use a KPI dashboard to run your business.
You don’t need to drive your car with a speedometer or a gas gauge.
And you don’t need your mobile phone to tell you the time or how long until its battery is dead.
You can guess where you’re at, where you’re going, and if you have what it takes to achieve your goal. If you check key numbers on your car or phone, why wouldn’t you monitor the key numbers for your business?
A small business KPI dashboard cuts through the clutter of numbers so you can monitor the most important measures of your success. You can quickly check it to see if you need to make changes or celebrate successes.
A small business KPI dashboard cuts through the clutter of numbers so you can monitor the most important measures of your success.
The three basic steps for building and using a small business KPI dashboard are:
- Select the best metrics
- Set the performance targets
- Supervise your company’s performance
Step 1: Select the metrics for your Excel KPI dashboard
Picking the right metrics is crucial. You don’t want to waste your time measuring the wrong metrics.
Measurement is never done for the sake of itself. It’s the means to an end. The end may be productivity, profitability, or customer satisfaction. Your measures are quick ways to assess the effectiveness of the organization. You can quickly identify where successes are occurring or areas that need to be addressed.
I go into much more detail on picking the right KPI metrics in my article explaining How Key Performance Indicators Guide Your Company to Success.
Keep your company focused on its goals by picking metrics that support those goals. I go into more detail on all these steps in my course on Key Performance Indicators (KPIs) and KPI Dashboards.
One of my duties as the SVP of Finance of a company was to lead meetings where we picked metrics and targets. We assigned responsibility to senior leadership for those metrics.
- The process began at a senior leadership planning retreat in early fall. We identified the key goals for the next year and a few of the key metrics to monitor those goals.
- Next, we would clarify the 10-15 key metrics we would monitor over the next year and how those metrics would be calculated.
A small business doesn’t need a planning retreat to set its metrics. Here are some quick ways to identify metrics:
- Look at the key numbers you currently monitor each day, week, or month. Those are likely your key metrics.
- Look at your goals. How do you measure success for that goal? That measure is a metric.
Once your metrics are clearly defined, it’s time to set the targets.
Step 2: Set the targets for your small business KPI dashboard
Good targets balance a metric’s past performance and what you want it to be in the future.
Ask yourself these two questions for each metric:
Question 1: What has the metric been in the past?
You’ll need to do some research into past data from your financial, customer service, or operations systems. You can delegate this to someone with the technical knowledge to pull the numbers from these systems. It may be an employee, your bookkeeper, or CPA.
Sometimes you don’t have past data. I’ve run into this many times. You may have a good idea of your past performance for the metric or what the metric should be. If so, use your educated guess as the starting point for the target.
You may not have a good guess about your past performance for a metric. Start tracking it for a while before adding it to your KPI dashboard. Begin that process now to set a good target in the future.
Setting a target without a reasonable basis for it can be confusing and demoralizing for your staff. Early in my career, I worked at a company where an arbitrary goal led to bankruptcy of the company.
Question 2: What performance target do you want to achieve in the future?
Knowing your past performance allows you to set reasonable targets.
For example, let’s say a company has been getting customer satisfaction scores of 5 out of 10. This is a big problem and a good candidate for a metric. They want to get a score of 10.
Setting the metric at 10 is a mistake for two reasons:
- It’s going to take time to improve the customer experience. The company will likely need a series of projects or steps to get 10s. Pick targets that track this progress. Set a target of 7 for next month, 8 for the following month, and 9 for the month after that.
- Getting a perfect score is aspirational but unattainable. There are always haters. Some people are never satisfied. Keep realities like this in mind when setting metrics. Getting an average score of 9.5 may mean you’re doing everything correctly, but you can’t please everyone.

You also must decide the probability your company can reach the goal. Setting a high stretch goal may push the company to increased achievement but might also demoralize staff. I go into this in more detail in my article on setting good KPI metrics.
Setting performance ranges
Do you want to grade your company’s performance on a pass/fail basis or a range of results? Here are some pros and cons of the two methods:
- Pass/Fail is simple. Either you achieved it, or you didn’t. Once it’s achieved, what motivates your staff to push for even better results? That’s where a range of grades may be useful.
- A range of results gives partial credit when your company is just below the target. A range also motivates staff to keep getting better after reaching a target.
Ranges of results are often indicated by a series of colors. For example:
- Red – Well below target
- Yellow – Slightly below your target.
- Green – At target or slightly above target
- Blue – Some dashboards add blue or some other color to highlight exceptional performance.
Step 3: Using Your Small Business Excel KPI dashboard
Setting up the dashboard is easy when you’ve done the steps above. You want a dashboard that can quickly tell you whether you’re on-track to meet your targets or whether adjustments are needed.
I’ll walk you step-by-step through an example. Your bookkeeper or an employee can update this for you on a monthly or quarterly basis.
Below is an example dashboard using an Excel template from my KPI course or FAST membership. You can also download free Excel templates from SmartSheets.In this example, the three little pigs started a thriving brick house business. They learned valuable lessons from past home design experiments. Many people don’t realize that the wolf was a product tester of some of their beta house designs.
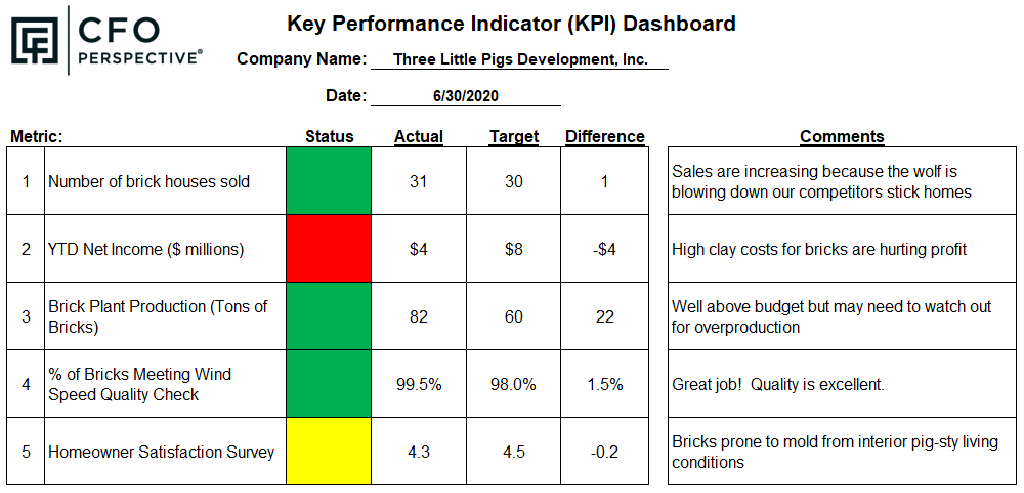
During the year, the first step to build your small business KPI dashboard is to list each of the metrics.
Next, enter the actual results for the period and the target or budgeted results for the period. The Excel KPI dashboard template will calculate the difference for you.
Most managers quickly scan for any red items that need improvement. This is important, but don’t forget to celebrate the green or blue items where you see success.
You can use the comments column in a couple of ways:
- From your accountant or the employee that updates the dashboard to you. They can research and note the causes of the performance variances from the target. You could instruct them to add comments for items with a red status and don’t spend time on the rest.
- To employees: Employees should also see the dashboard. Your dashboard defines success and measures progress toward that success. Explain why each metric is important and how each metric is calculated. The comments section allows you to communicate updates and celebrate achievements.
The timing of when you update your metric and who receives it is different for every company. You may update it quarterly and you are the only person who reviews it. You may update it monthly and distribute it to all your staff.
If you distribute it to your staff, send a version at the beginning of the year that lists the metrics, targets, and comments about the importance of each metric. Hide the “Actual” and “Difference” columns. Then send the full dashboard with actual vs. target results during the year.
Select, Set, Supervise
Improving your small business with a KPI dashboard is as easy as 1-2-3:
- Select the best metrics
- Set the performance targets
- Supervise your company’s performance
Picking your metrics and monitoring them with a small business KPI dashboard turns confusion into clarity. For a complete guide to setting up and managing with KPIs, check out my KPI Course.
For more info, check out these topics pages: