There are so many things you could look at to monitor your business finances. Where do you start? The reports below will help you improve the performance, cash flow, and profitability of your company.
I’ve grouped these business finance reports into three groups:
- Backward-looking
- Forward-looking
- The one critical report you should be monitoring.
For each business finance report, I’ll give a quick summary of what it does and why it’s important. I’ll then explain what you should be looking for to improve your business finances.
You can jump directly to a business finance report by clicking its title below:
- Backwards-Looking
- Forward-Looking
- One critical report that summarizes them all: a KPI Dashboard
Backward-Looking Business Finance Reports
Balance Sheet
What it Does
The purpose of the financial statement is to summarize what you own (your assets) and what you owe (your liabilities). The difference between these two is called equity or net worth.
Don’t confuse the equity on your balance sheet with your company’s value if you were to try to sell it. Equity on your balance sheet is the sum of the capital put into the company, plus earnings, minus distributions to owners. It’s focused on the past. The value of your company is an entirely different number based on your future earnings.
Why it’s important
This is your high-level summary of what you own and what you owe. Many of your assets are future sources of cash, while many of your liabilities will require cash payments in the future.
What to Look For
- Cash, investments, and other short-term sources of cash: Nothing is more important to a business than enough cash to sustain operations. Make sure you have enough for future needs.
- Buildings, Furniture, and Equipment: Scan through the detailed list of these assets to plan when you need to make more investments. The cash section and investments section above lets you know if you have enough free cash to make those investments.
- Payables: These are the items that need to be paid with cash in the future. Make sure you have a plan to meet these cash needs.
- Debt: The outstanding balance of your loans is listed on the balance sheet. You need a plan to pay that back when due. Sometimes a more significant number is the amount you’re able to borrow on a line of credit, which isn’t listed on your balance sheet.
- Equity: As your equity builds, decide whether to keep it invested in the company or distribute some of it to the owners.
Learn more about key balance sheet ratios in Net Working Capital: Formulas, Examples, and How to Improve It.
Income Statement (aka Profit and Loss “P&L” Statement)
What it Does
The income statement lists your revenues less your expenses, which equals your net income. The literal bottom line of this report (net income) is the figurative “bottom line” for your company.
Why it’s important
Your company needs to be profitable in the long term. The income statement tells you how profitable you’ve been in the past. Look at the expense items to identify ways to reduce expenses.
What to Look For
- Gross Profit: This is your revenues less your cost of goods. Find ways to increase your revenues more than your cost of goods. Growth in top-line revenue provides little value if the cost of goods is rising faster. A quickly rising cost of goods may point to operations issues that need to be addressed.
- Selling, General, and Administrative (“S,G&A”) Expenses: This can be where profits are made or lost. Most companies start with low S,G&A expenses. It’s easy to let expenses grow unchecked when you have cash in the bank. S,G&A is not inherently bad; it’s the critical infrastructure needed to support the entire sales process. Top companies stay lean without reducing the profitable growth potential of the company.
- Net income: It goes without saying that the bottom line matters. What you may have also heard when big companies release their quarterly financials is their “quality of earnings.” Investors want to see earnings that the company can consistently sustain in the future. Are your earnings repeatable or a one-time windfall?
Cash Flow Statement
What it Does
Summarizes the cash inflows and outflows in three main categories: operations, investing, and financing.
Why it’s important
Cash is the lifeblood of business. You need positive cash from operations to pay down debt, invest for the future, and provide cash to owners.
What to Look For:
What’s more important than positive net income? Positive operating cash. Your business must maintain positive operating cash flow to survive and build value. A solid cash position from investing and financing sources can mask weakness in operating cash.
I explain more about profit vs. cash flow in Cash flow vs. profit: Catch the One You Most Want.
Budget-to-Actual Report
What it Does
Compares actual income statements to the budgeted income statement. The same may also be done for the balance sheet or cash flow statement.
Why it’s important
Your budget is the financial projection of your business plan. Today’s small budget variations could lead to big variations in the future.
What to Look For
When there are wide variances, assess whether the projection was bad, or if you need to make changes to get back on plan. Check for process improvements or simple accounting errors in areas with large variances. Celebrate large positive variances and look for more opportunities. You may have the opportunity to shift production from an area of negative variance to an area of positive variance.
Trend Reporting

What it Does
Lists key numbers over multiple time periods. Trends are much easier to see if they are graphed. For example, it’s very easy to spot trends in a graph that tracks monthly revenue for each of the past twelve months.
Why it’s important
It’s hard to see small changes in the day-to-day activity. You need to step back and look at larger trends to see how small changes compound into big shifts in your business.
What to Look For
The most powerful historical report may be the trend report. Your budget represented your best guesses at a point in time in the past. As time passes, those guesses become less relevant and accurate. A monthly income statement provides no context whether the company is improving or starting to slip.
The first report I reviewed each month as the CFO of small companies was the comparison of the current month’s income statement to last month’s income statement. I could easily detect issues that needed to be addressed. I also used it to catch accounting errors.
Look at the trends for patterns. See if “the trend is your friend” or whether you need to change the pattern.
Forward-Looking Business Finances Reports
Backward-looking business finance reports provide important data, but decisions are always about the future. Relevant information for decision-making can be found in forward-looking business finance reports. There is little to be done about past events. Forward-looking reports help identify opportunities and anticipate problems.
Cash Flow Projection
What it Does
When cash is tight, a cash flow projection is your most important report. The time periods for reporting are different for every company. Companies with volatile cash flows should project shorter time periods than companies with stable cash flow or more cash resources. I often used a cash flow forecast with weekly cash flows for the next three months, and monthly cash flows for the remaining nine months to have a full 12-month projection of cash flows.
Why it’s important
You want cash ready to go when you need it. Make plans to be sure it’s there when you need it.
What to Look For
Companies fail from lack of cash, not lack of income. The bare minimum expectation is a positive cash balance for each projected period. It’s better to have a minimum cash balance above zero for each period to provide a cushion for the unexpected. The sooner you can predict a low point in cash, the more options you have to build cash. You can delay cash outflows, speed up cash inflows, or find other sources of cash.
I explain more about projections in How to Conquer Cash Flow Chaos with a Cash Flow Projection.
Sales Pipeline

What it Does
Lists all potential sales and gives a percentage chance of winning the sale for each. It may also list the expected period (e.g., day, week, or month) that the sale will occur.
Why it’s important
You want to know how much business you will have in the future to know what resources you need to start lining up now to be ready for it.
What to Look For
One of the earliest indications of future income, cash, and operational needs is projected sales. A strong pipeline allows time to build cash and operating capacity to meet the demand. A weak pipeline may mean future cash flow will be less than anticipated. Expenses will need to be reduced, or other sources of cash may need to be tapped.
Accounts Receivable (A/R) Aging Report
What it Does
A detailed A/R report lists every invoice due from each customer and how many days it’s past due. The report summarizes receivables into time buckets of how far they are past due (e.g., current, <30 days past due, 30-90 days past due, and 90+ days past due).
Why it’s important
Your cash is often sitting in your customer’s bank accounts. Ask for it! The longer customer become past due, the harder it is to collect their money.
What to Look For
Cash you haven’t received is cash you can’t use for your business. It’s amazing how companies pay interest on loans while having large amounts of money owed to them from customers that earn no interest. Letting customers buy on credit can increase sales, but it comes with risks and costs. Contact customers as soon as they become past due. Customers learn to pay you on time if they know you will be contacting them about any past due invoices. You may need to set up a workout plan for severely past-due accounts or send them to a professional collections company. If you want to make a sale on credit, you should be ready to collect on that sale.
And Finally, the One Key Report … the KPI Dashboard
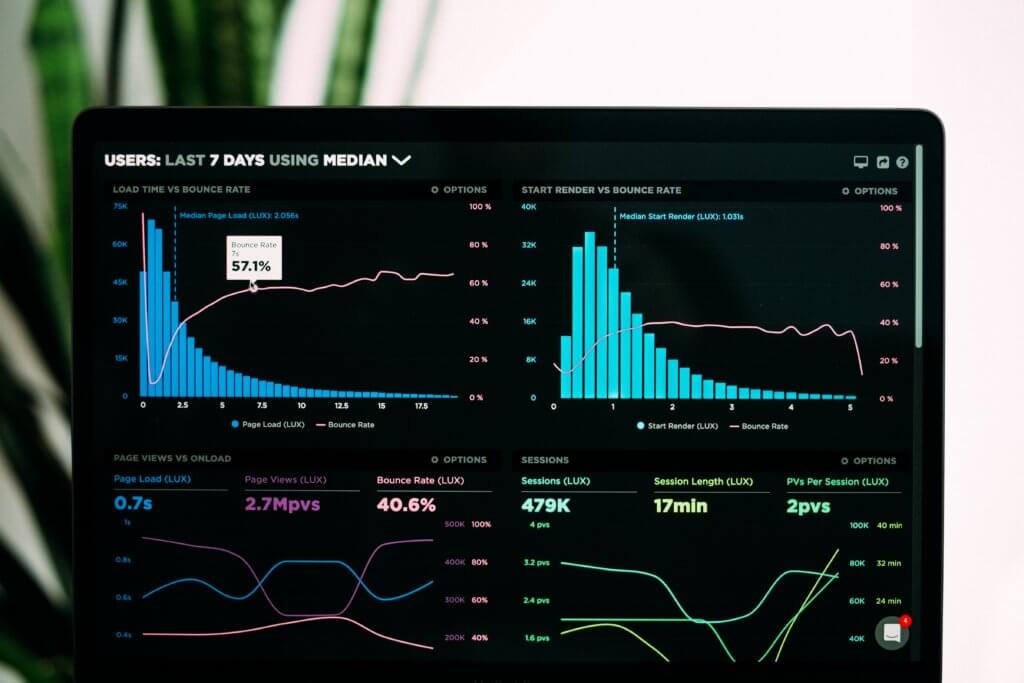
What it Does
The dashboard list the status of key metrics of your success. They’re often compared against a target or budget. Use graphs, color coding, or symbols to quickly communicate if results are above or below your target.
Why it’s important
You want one place to frequently get a quick pulse of your business finances. This allows you to constantly make adjustments and improvements.
What to Look For
Two key benefits of the dashboard are to communicate and to prioritize. It is a simple report to communicate to everyone how the company defines success and whether the company is achieving that success. It prioritizes by highlighting weak areas that need immediate attention. Are you well above target for a metric? Then celebrate your success!
Want to learn more about KPI dashboards? Check out my course on KPIs.
Keeping the Pulse of Your Business Finances
All these reports work together to give you the complete picture of the health of your business finances. Your dashboard gives you an overview. Use it to quickly identify actions you need to take or successes you need to celebrate. The other reports give detailed information about different persepectives of your business finances.
For more info, check out these topics pages: