How to improve your estimates for the high and low ranges of your company’s performance.
“It was the best of times, it was the worst of times.” So begins the Dickens book A Tale of Two Cities. He was talking about the extremes of one time period. Bookending is looking at the potential extremes of a company’s future. A company must be ready for any outcome in the range between those extremes.
Bookending Definition
In bookending analysis, you enter model input amounts that are higher and lower than the base case amount. It’s also known as bracketing. It’s sometimes thought of as creating a best-case and worst-case scenario. It can be done with each assumption one at a time for sensitivity testing.
Many times, models are built with inputs for a high, low, and base case amount. For example, forecasted sales might be $1 million for a new product, but leaders want to see the profits at $100,000 in sales and $3 million in sales to see a broader range of risk and reward.
Defining the High and Low Amounts
In bookending, you don’t usually pick the highest and lowest number possible or that you would ever expect.
The low number is usually an amount for which you would predict that you would only see a number lower than that amount 10% of the time. The high amount is also an amount for which you would predict to only see amounts higher than that 10% of the time. Another way to describe the high number is the amount for which 90% of the expected numbers are below it.
A way to think about this is in terms of deciles. Imagine a set of data that’s listed from the lowest number to the highest number. Deciles divide that set into ten equal subsets of numbers. Imagine a data set of 1,000 numbers. Each decile contains 100 numbers (i.e., 1000 divided by 10). The first decile starts at the lowest number and goes up to the 100th lowest number. The 100th lowest number is sometimes called P10 since there is a 10% probability (P) that a randomly picked number is lower than it (i.e., 100 divided by 1,000 equals 10%).
The middle number in the number series is called the median. When making predictions, the median value is called P50 because there is a 50% probability that a randomly picked number would be below it. The 90% probability number is called P90 because there is a 90% probability that a randomly picked number would be below it.
To further explain deciles, below is an analysis from the United States Bureau of Labor and Statistics (BLS). It shows the first decile, median, and ninth decile amounts for weekly earnings by education level.
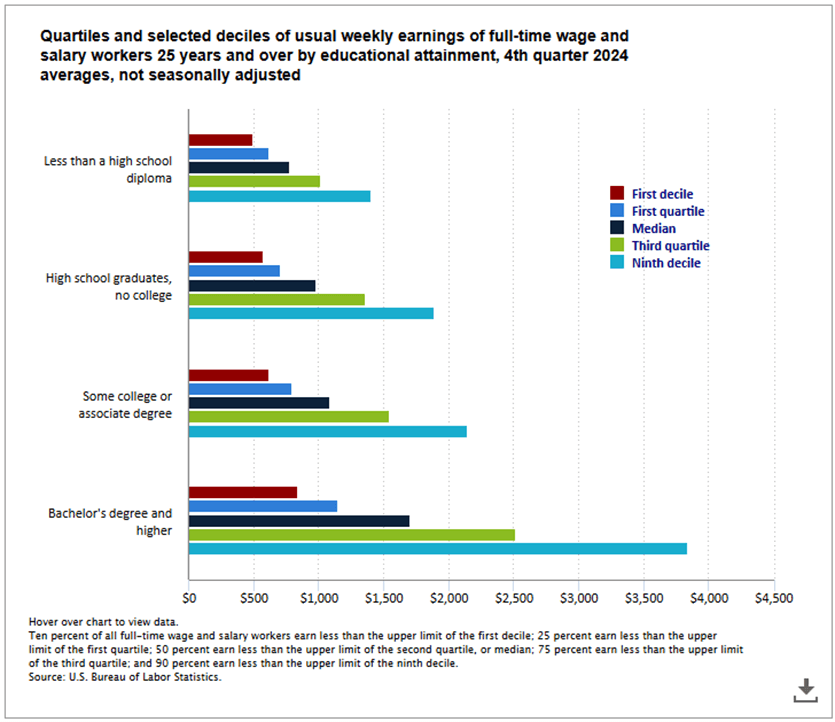
Chart From: https://www.bls.gov/charts/usual-weekly-earnings/usual-weekly-earnings-by-quartiles-and-selected-deciles-by-education.htm
Note that there is a good explanation of the median and deciles at the bottom of the graphs.
The median is the middle value if all wages were listed from high to low. The average is much higher. There are CEOs whose wages seriously skew the average higher. There are many people making small amounts and a few people making very high amounts.
This graph shows deciles for observed past data. The P10 and P90 values in bookending represent probabilities for future low and high values.
Examples of Low, Base, and High Numbers
Below is a simple table of low, base, and high values for bookending. This is for a hypothetical company that’s thinking about opening a new retail store. They want to know the best- and worst-case values for key assumptions. The base case is their best estimate for the key assumptions, which is often the median (P50) value. Potential values are assumed to cluster around the median value. In other words, a large percentage of them are fairly close to the median.
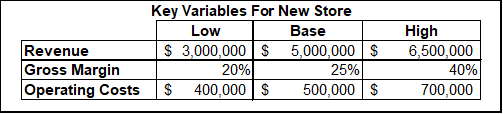
They think there is a 10% probability (P10) that sales will be $3,000,000 or lower. There is a 90% probability that sales will be $6,500,000 or lower. Note that the difference between the low sales amount and base sales is $2,000,000, but the difference between high and base sales is only $1,500,000. I’ll spend more time later explaining why those two differences don’t need to be the same. Another key assumption is the gross margin.
A third key assumption is operating costs. Here, we get into some semantic issues. For sales, low numbers are detrimental to profit. However, low operating costs are beneficial for profits. Be clear in reports about whether “low” means a low number for each assumption or a value that leads to a lower profit. If “low” means a low number for each assumption, you can’t just use all the low numbers to create a stress scenario because some of those “low” numbers improve profit.
Stress Testing
Stress testing is a form of analysis of a “low” or “bad” scenario. It may be a very low-probability scenario, which might be a use case for using a series of P10 assumptions to build a scenario. Even if you don’t do that, it’s still very important to think through the linkages between the assumptions in a crisis. Sometimes detrimental assumptions are correlated, so they happen together; sometimes they aren’t.
Before the Great Recession, many banks thought they could borrow from other banks if they needed liquidity in a crisis. What we found was that sometimes things are so bad that no banks are able to or willing to lend to each other.
When I created the stress scenarios I mentioned in the first lesson, the scenarios went from mild to severe. In the severe scenarios, I projected major outflows of deposits, and at the same time, we had the least number of options for raising funding.
Some small companies assume they can tap owners’ savings in a recession. They don’t anticipate that the owners don’t have much to contribute to the company when the stock market is also down 50% in the recession.
Stress test scenarios aren’t necessarily ones you use in the range of options considered during strategic planning or budgeting. They should be considered occasionally to make sure the company has secure options for survival.
One tip on stress testing is to do it for both profit and cash flow. Lack of profits is inconvenient. Lack of cash is quickly deadly.
Break-Even Analysis and the Margin of Safety
Break-even analysis and the concept of margin of safety are related to bookending. In break-even analysis, companies usually determine the sales volume that causes their profit to equal zero. For a long-standing company with strong sales, that break-even sales volume scenario may be similar to the “low” scenario or a stress-test scenario. A scenario is truly stressful if your company is burning cash. Time is working against you because you have a limited amount of cash.
The margin of safety is the difference between your expected performance and the break-even amount. It’s similar to the difference between the base case scenario and a low or stress scenario. It can be measured in units or revenue. It can also be expressed as a percentage or ratio of the expected performance.
Check out my course on cost-volume-profit (CVP) and break-even analysis if you want to learn more about this.
Improving Estimates
Bookending seems easy, but it turns out that people are not very good at it. We set an interval between the low and high values that is too narrow. There are ways we can improve our estimates to widen our vision to the true range of potential for our business.
Improving our View
Two major benefits of bookending are to improve our awareness of what’s possible and to improve the accuracy of what’s probable. People tend to underestimate the range of potential outcomes.
The range between the P10 and P90 values I’ve discussed is an example of a confidence interval. A confidence interval is defined by Wikipedia as “a confidence interval (CI) is an interval which is expected to typically contain the parameter being estimated.” The range between P10 and P90 represents an 80% confidence interval because it excludes the bottom 10% and top 10% of potential values (i.e., 100% – 10% – 10% = 80%). The person making the estimate is saying there is an 80% probability that the actual number will be in the range between their P10 and P90 numbers.
A study[2] found that “subjective confidence intervals are indeed systematically too narrow — sometimes only 40% as large as necessary to be well calibrated.”
In his book You’re About to Make a Terrible Mistake, Olivier Sibony did a great job summarizing studies of how we overestimate our ability to predict the future when he said, “Simply put, when we’re 90 percent sure, we’re wrong at least half of the time.”
Finance staff often must ask subject matter experts in the company for estimates of assumptions for analysis. What you want to do is have experts or decision-makers stretch their vision beyond a single base case and a small range around it.
People are prone to anchoring on a number presented early in a discussion or analysis. Studies have shown that anchoring can be driven by numbers that are not even related to the decision. That means a base case number may have been tainted at the beginning of the decision process.
Further, once a base case number is the anchor, people adjust too little from the anchor number when given information that shows that the initial estimate is incorrect. This means that the base isn’t adjusted enough to make it accurate, and the low and high numbers are too close to the base. I’ll explain two methods for setting ranges later in this lesson.
Calibrating Intervals
As noted earlier, people tend to set too small of a confidence interval when estimating numbers. Douglas Hubbard provides ideas for ways to help people improve the calibration of their intervals in his book How to Measure Anything.
In one method, people are given a series of difficult trivia questions. The answers to the questions are a number (e.g., a year, a measurement, etc.). For some questions, participants provide the upper and lower bound of a 90% confidence interval of where the actual answer to the question may lie. They find that the actual answers lie inside the confidence interval bounds much less than 90% of the time that they should. In other words, their confidence intervals are too small.
He does a similar exercise where people give confidence percentages of being right on true/false questions. Once again, their reported confidence is much higher than the percentage of questions they get correct.
This makes us aware of our tendency for overconfidence and overprecision. We learn that we must set wider confidence intervals to match reality.
Hubbard claims that insights learned from the trivia exercises carry over to other domains like business decision-making. You could also track estimates and confidence intervals from business data compared to the actual results. This will show the same bias. It takes longer to compile the data and learn about our biases than the trivia questions, but it’s based on more relevant business data.
One thinking exercise Hubbard recommends for widening the interval is to think of two reasons why a person should be confident in their assessment and two reasons why they shouldn’t. It’s like conjuring up a “devil’s advocate” in your head to counter your mind’s natural tendency to think why the assessment is correct.
Another exercise is to begin with extremely high and low numbers for each of the bounds of the range. People tend to anchor on a base number and then underestimate the bounds. This exercise uses anchoring to our advantage by offsetting our natural biases. We start with extreme numbers and then adjust them toward the base or median number.
Hubbard’s recommendations are similar to those of a study I cited in an earlier lesson.[4] They found that when people “are asked for separate low and high 90% judgments rather than a single 80% range, their intervals become wider and the correct answers are closer to the centers of their intervals… The result is two separate searches for evidence in two different regions of knowledge. This increases the range of evidence considered (making judgments more accurate) while making the variability of implications more apparent (increasing interval width.)”
The study also offers an intriguing way to improve the base case number: “Now, add another request, namely for the point at which the correct answer seems to be equally likely to be above or below… [which] provokes a third search in yet another region of knowledge, again increasing accuracy and also the sense of the variety of implications of different evidence.”
Premortems and Preparades
In scenario planning and stress testing, we often identify assumptions that are highly detrimental to earnings to calculate their combined impact. Premortems start in the opposite direction. We assume failure. We then determine what happened to cause that failure.
Premortems were developed by psychologist Gary Klein. Just before a group of decision-makers is about to commit to a plan of action, they are given this task: “Imagine that we are a year into the future. We implemented the plan as it now exists. The outcome was a disaster. Please take 5 to 10 minutes to write a brief history of that disaster.”[5]
This can reduce groupthink and widen the confidence interval by pushing participants to contemplate the disaster scenario.
A similar thought experiment is the “crystal ball” test. In this test, the group is told to “assume a crystal ball said your most unlikely hypothesis was true. How could this possibly have happened.”[6]
This is also a good way to challenge the lower bound of a range of outcomes. Finding reasons why those amounts may occur may increase their probability to us, causing us to pick numbers further away from the median as the P10 amount.
The premortem and crystal ball test focuses on the lower bound of possible outcomes. In their book Decisive, Chip and Dan Heath recommend a “preparade” in addition to a premortem. This helps groups contemplate and widen the upper bound. The preparade question is similar to that of the premortem:
“Let’s say it’s a year from now and our decision has been a wild success. It’s so great that there’s going to be a parade in our honor. Given that future, how do we ensure that we are ready for it?”[7]
The question jumps quickly to how to prepare for opportunities rather than outlining how or why the decision was a success. The exercise can still lead to thinking about reasons for the success. Since we are prone to overoptimism, we may find it easier to explain the success of a preparade than the catastrophe of the premortem. The preparade question can lead to action for capturing opportunities.
Mistakes When Picking Low/Base/High
A common mistake when selecting bookend amounts is to add and subtract the same amount (e.g., 10%) from the base case number. This is flawed. Let’s look again at the BLS analysis of wages.

Look at the first decile, median, and ninth decile amounts for “Bachelor’s degree and higher.” The difference between the median and the first decile is much smaller than the difference between the ninth decile and the median. This is from the skew in the data that I mentioned earlier. Many business decision assumptions have this skew, causing the P10 and P90 amounts to be different amounts away from the base case.
Below are inflation rates from 1958 to 2023. Notice that the average is higher than the median. The difference between the 90th decile and the median is much higher than the median minus the 10th decile. The difference between the base and low bound of our bookend bounds should often be different than the difference between the high and the base.
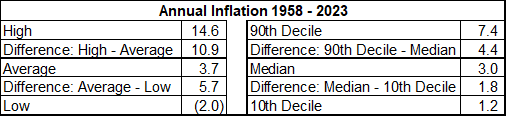
Another mistake is to use historical data like this without adjustment to make future predictions. In other words, the 90th decile from the past may not be the P90 for the future. Just because we haven’t seen sustained inflation well above the 90th decile amount in the past doesn’t mean we won’t in the future. People didn’t think that housing prices could drop significantly across the country until they did from 2006 to 2010.
Also, the less data you have from the past, the less reliable it may be for future predictions. Even with robust data, the future may be totally different than the past. As investment companies like to warn, “Past performance is not indicative of future results.”
Low/Medium/High Options
So far, I’ve talked about finding a wide range of possibilities around a base case. A related concept is when decision-makers are given three scenarios to choose from. Often, these take the form of low, medium, and high investment costs. For example, the low investment may be to remodel a building, the medium cost would be to move to a slightly larger building, and the high cost would be to move to a much larger building. Some companies require departments to provide three budgeting options in decision packages for zero-based budgeting.
If you have taken my course on behavioral finance, you know that people tend to pick the middle option when given three options. Consumers, given the choice between the good, better, and best options for a product, tend to pick the middle “better” option.
It turns out that supposedly smart company decision-makers tend to do the same thing. A Harvard Business Review article discussed scenario analysis at Shell, which has been a leader in scenarios. The article noted, “By the mid-1970s three scenarios were common, but that tempted managers to choose a “middle way” as a best guess. Starting in 1989, two scenarios became the norm, enhancing usability and recall. Two stories open the mind but don’t numb it with too many variables.”
Using the three points of low, base, and high in a range of possibilities for sensitivity analysis can be effective. Two scenarios may be better than three when deciding among business strategies.
Combining P10 Assumptions is Not a P10 Scenario
That title may not have meant much to you, so let me explain. People sometimes think that if they use a set of key assumptions that individually have a 10% probability of occurring (i.e., P10), then they have created a scenario that has a 10% probability of occurring.
This is rarely the case. I won’t bore you with the math, but the probability of a scenario occurring comprised of P10 assumptions is actually much lower than 10%. To illustrate why this is the case, the odds of rolling the number one on a six-sided die is one in six, which is around 17%. The odds of rolling three ones simultaneously with three dice is 1/6 X 1/6 X 1/6 = .5%. I guess I couldn’t help myself from doing a little math to explain this.
The caveat to what I’ve just said takes us back to my earlier comment that “when it rains, it pours.” The math I’ve done so far assumes independence of the outcomes of the assumptions. There are often linkages or at least correlations between assumptions. For example, inflation can cause rising costs for inventory and decreasing sales demand. Companies that don’t anticipate this get hammered from both sides on profit and cash flow. The tighter these linkages, the higher the probability that a combination of assumptions will occur together. When building scenarios, you have to assess the potential for these linkages.
A scenario with a very low probability of occurring is not worth spending much time on. It’s definitely not worth spending large dollars mitigating a remote outcome unless the outcome would ruin the company. At the other end of the spectrum, spending money on a remote possibility of a windfall is gambling.
Using P10 and P90 values for assumptions is good for sensitivity testing but creates a very large range of outcomes. It may help you become aware of the breadth of possible outcomes. The extremes are possible even if they are not probable. You will usually want to pick assumptions that are more likely to occur than 10% to build P10 and P90 scenarios.
For more info, check out these topics pages:
[2] Soll, Jack & Klayman, Joshua. (2004). Overconfidence in Interval Estimates. Journal of experimental psychology. Learning, memory, and cognition. 30. 299-314. 10.1037/0278-7393.30.2.299.
[4] Soll, Jack & Klayman, Joshua. (2004). Overconfidence in Interval Estimates. Journal of experimental psychology. Learning, memory, and cognition. 30. 299-314. 10.1037/0278-7393.30.2.299.
[5] P. 264 of Thinking Fast and Slow by Daniel Kahneman
[6] P. 39 of Handbook of Decision Analysis by Parnell, Bresnick, Tani, and Johnson
[7] P. 206 of Decisive by Chip and Dan Heath