Variance analysis tells us about past performance versus our forecasts to help us make more accurate forecasts in the future. Of course, these reports also help us manage the company. Let’s look at what we can learn from variance reports to improve our forecasts.
Budget-to-Actual Variance Analysis
The budgeting process consumes a massive amount of a company’s time and resources. All the company’s key assumptions are compiled to calculate the budget. Many of those assumptions are updated for the budget. Budget-to-actual variance reporting allows us to identify the weaknesses in our budget to improve forecasting.
Forecasts may vary from actual results due to a few reasons:
- Model Errors: The inputs or formulas to the forecast model may be incorrect. These are technical errors that are easy to fix.
- Lack of Data: Data that was important for building an accurate forecast was unavailable when the forecast was developed.
- Human Error: Some people tend to overestimate numbers, while others underestimate numbers. Groups are vulnerable to groupthink, which can lead to poor estimates and decisions. Budgeting is especially prone to gamesmanship.
- Lack of Clairvoyance: Life is full of surprises. We can’t perfectly predict the future.
I’ll discuss the above issues in more detail in a later lesson. For this lesson, the calculation and research of a budget-to-actual variance report allows us to identify forecast errors that we can correct to improve future forecasts. The action to be taken to improve forecasts is different for each type of forecasting error:
- Model Errors: The forecast or budget model should be corrected. Additional controls may be needed to reduce errors.
- Lack of Data: Management may decide to allocate the resources to find or build the data. Some data can only be obtained as time progresses (e.g., data about new products).
- Human Error: Being aware of thinking errors is the first step. The next step is to improve the decision-making process to mitigate these errors.
- Lack of Clairvoyance: People have been reading tea leaves, animal entrails, and crystal balls for millennia. Nothing has worked yet.
Sample Budget-to-Actual Reports
The first budget-to-actual report of the year is often a test of the budget as much as it is an indicator of company performance. I once made a mistake in the budget that became apparent with the first variance report. I added more quality checks to the budget process and didn’t make that mistake again. Of course, I made other mistakes over time that required other changes to the forecast model.
Let’s start with a very high-level budget-to-actual report.
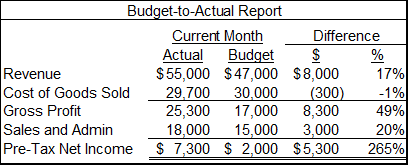
This is a very simple income statement. It shows the differences between budget and actual amounts in dollars and as a percentage of the budgeted amounts. We have some large variances in most line items, but the cost of goods has a small variance. This report is much too high-level to identify the causes of the variances. We need to drill down into more detail.
The report below focuses only on revenues and the cost of goods. The variances in these line items are likely strongly driven by the volume of goods sold, the price at which they were sold, and the cost of each unit. Variances in sales, general, and administrative (SG&A) costs likely have other drivers that would be identified via other methods than the report below.
I noted earlier that everything can be broken down into a volume variance and a rate variance. A rate/volume variance report breaks out the total variance for each line into a rate variance and a volume variance.
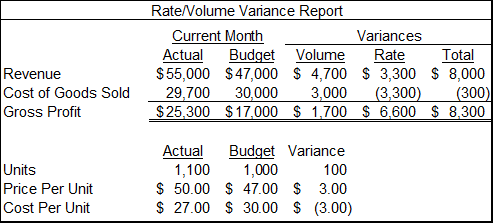
The volume variance is calculated as: (Actual units – Budget units) X Budgeted price per unit.
The rate variance is calculated as: (Actual rate – Budget rate) X Actual number of units. The “rate” for revenue is the price per unit. The “rate” for cost of goods sold is the cost per unit.
We can now see that the small cost of goods total variance is comprised of a large positive volume variance and a large negative rate variance. When discussing a variance report, using words like “positive” and “negative” can be very confusing. The costs of goods rate variance is negative, but this is a good thing because actual costs were below budgeted costs. It’s better to refer to variances as favorable or unfavorable with respect to net income. Some variance reports will place an “F” or “U” next to numbers to designate favorable or unfavorable. This is especially useful when the report users aren’t well-versed in financial statements, like members of a non-profit organization board of directors.
The table at the bottom of the report shows the source numbers for the report. They show the exact volume and rate amounts that led to the dollar differences at the top of the report.
This report is beginning to tell the story of what’s driving the variances. However, there is likely much more root cause analysis that needs to be done, which I’ll explain in a later lesson.
Of course, financial analysts have devised ways to deconstruct the variances into four types of variances:
- Price
- Quantity
- Mix
- Volume
The cost of goods variances can be deconstructed into a series of variances by type of input. They include:
- Materials variances
- Labor variances
- Overhead variances
How to drill down through the variances is different for each industry. Mix variances were very important when I was the CFO of a health clinic system. Service companies don’t care about materials variances. They closely watch variances in employee utilization. For this short course, I won’t get into all these variances.
Variance Analysis for Performance Drivers
Some companies use driver-based forecasting for rapid forecast development. For more information on this process, check out my Rolling Forecasts course. Other companies may not use driver-based forecasts, but do know the key drivers of their business performance. Tracking the variances of the key drivers can quickly identify which drivers are causing actual performance to deviate from forecasts.
The variance analysis below starts with a standard variance analysis for a service company. The revenue variance is then broken into a rate/volume variance. The bottom of the report shows variances in the key performance drivers of revenue. The performance driver variances provide detail as to the causes for the rate/volume variances.
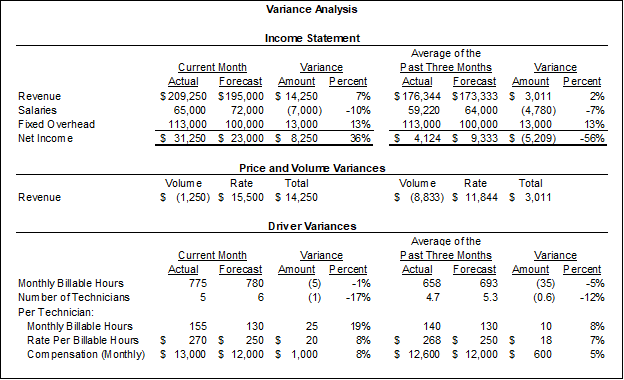
In the bottom section, we quickly see that the company had one fewer technician than they had forecasted. This reduced salaries, but also may have impaired billable hours.
A high bill-out rate and high staff productivity caused total billable hours to land only slightly below the forecast.
What are some potential takeaways from this driver variance analysis?
- The utilization was very high. This may be unsustainable. The technicians may be burning out, which could cause them to leave. This would further cause a key revenue driver, the number of technicians, to fall further below the forecast. The increased compensation per technician over the forecast may be an incentive compensation structure or discretionary bonuses to maintain morale.
- The bill-out rate for both the current month and the past three months is higher than the forecast. This assumption may need to be adjusted in the next forecast.
The format of this report also shows an important aspect of assessing forecast accuracy to improve forecasts. Variances are calculated for both the current month and the past three months. Both time periods are important for assessing accuracy. Comparing a period of three months or longer can take out some noise from small timing differences between a forecast and actual results. A sale that’s booked a month later than forecast may not be considered a big problem to management, especially if the sale still occurs in the quarter or fiscal year of the forecast.
On the other hand, accurate monthly forecasts are important when assessing whether you forecast seasonality correctly. Seasonality refers to recurring patterns of revenues and expenses. A retailer may have a sales spike during the holiday season. A landscaper may have a revenue spike during the summer. Capturing this seasonality is important for accurate forecasting.
Flexible Budgeting
“Flexible” or “Flexed” budget reporting adjusts budgeted volumes to actual volumes for variance analysis. In essence, the volume variance is removed to focus on rate variances.
The processes for developing volume and rate assumptions are often very different. Budgeted volumes are often developed from sales forecasts, finance forecasts, and targets for incentive compensation. To be honest, budgeted volumes are often politically derived numbers that no one believes to be the most likely outcome, but they were the numbers everyone could finally compromise on (in every sense of the word “compromise”).
If this is the case, volume variance analysis may provide little insight, other than for posturing for the next round of negotiations. Volumes in other forecasts may be less susceptible to gamesmanship. Volume variance analysis for these forecasts may provide information for improving future forecasts.
Rate variances are often derived from much more complex calculations of multiple assumptions. Digging into those variances in those assumptions and the accuracy of the calculations can provide important information for improving future budgets and forecasts.
I mentioned in an earlier lesson that I focused more on rate variances than volume variances when backtesting a bank’s asset liability model. The biggest improvements to model accuracy are often from improving the forecasting of rates.
The Flexible Budgeting Steps
A flexible budget adjusts variable expenses based on volume or sales thresholds. Flexible budgets are usually updated after the accounting period has been completed, generating a budget specific to the activity levels in that period. The steps needed to create a flexible budget include:
- Identify all variable costs and enter them into a budget template.
- Determine the volatility of variable costs compared to sales.
- Create a budget model that includes all fixed costs. These amounts will be hard-coded and are not expected to change, such as rent.
- Once the accounting period has been completed, enter the sales or units sold. This should update the variable cost totals in your budget template based on the volume.
- Enter the actual costs associated with that accounting period and compare the results.
Comparing your flexible budget to the expenses your business actually incurred highlights areas for improvement to help in the planning process. For example, maybe you budgeted that variable costs are 25% of sales, but they actually turn out to be 35%. That difference is crucial information for break-even analysis and gross margin management. This also gives you concrete information to implement actionable change, such as negotiating more favorable supplier deals or leveraging bulk order discounts.
Flexible Budgeting Reporting
Let’s assume that our budgeted revenue is $500 per unit, variable costs are $100 per unit, and fixed costs are $10,000.
Let’s say that we’ve just finished our first month of the budget year. First, we’ll look at a simple static budget report.
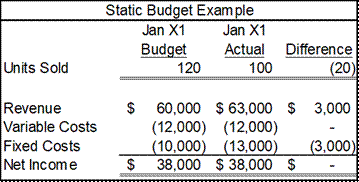
We sold 20 fewer units than budgeted for the month. This is bad, but net income was exactly what we budgeted for the month. There’s probably not a lot of hand-wringing or high-fives going on with management with no budget variance. Revenues and fixed costs were both a little higher than the budget. Variable costs were exactly on budget. Many people would glance at this, yawn in boredom, and move on.
Let’s now look at the flexible budget for the month.
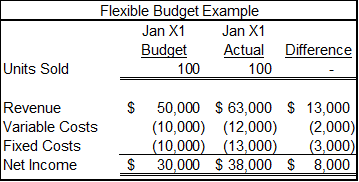
The budgeted amounts have been scaled or “flexed” down to the actual sales for the month. Budgeted revenues drop $10,000, and budgeted variable costs drop $2,000 from the static budget. That’s calculated as the $100 variable cost per unit multiplied by the 20-unit difference between budgeted sales and actual sales.
This report shows some interesting information. Revenue was much higher than expected for this volume. At the same time, variable costs were also higher. This may be from a common cause, like inflation, or there may be a cause for the variable cost variance that needs to be investigated. Overall, net income was much higher than budgeted for the sales volume.
There are controllable and uncontrollable flexible budget variance causes. Controllable causes include:
- Inaccurate cost estimation
- Poor historical data
- Improper planning
Controllable causes can be avoided with cost analysis in the creation stage. However, there are factors outside of your business’s control, which can include:
- Economic uncertainty
- Industry regulation changes
- Volatile material costs
A variance from controllable causes may cause you to update your flexible budget cost assumptions for the remainder of the year. A variance from uncontrollable causes means something has changed, and you must adjust your company in response to that change.
For more information on flexible budgeting, please check out my Better Budgeting course.
For more info, check out these topics pages: