Eddie Van Halen became one of the greatest rock guitarists of all time by playing very quickly. He used two-hand tapping to race through notes. Rolling forecasts require companies to forecast faster and with more frequency than they ever have before. They use drivers as their two-handed tap… on computer keyboards, of course. Let me show you how to become the Eddie Van Halen of forecasting.
Traditional Budgeting Recap
Let me quickly summarize the traditional process for compiling budgets to better clarify how it differs from using drivers. In practice, many department managers budget one line item, then calculate the budget for the next line item, and continue down through their budget input page. They may not use relationships between lines or a ratio to other numbers to calculate line items.
In bottom-up budgeting, each center budgets line items for their center and then sends their budget up multiple layers of review. The company budget is the sum of all the center budgets. Revenues are often too low and costs are too high in that first draft. And so the negotiations begin. Budgets are sent back out for revisions, sometimes multiple times.
What are Drivers?
Drivers are events, activities, or conditions that cause changes to the components of revenues, costs, and cash flow. For math fans, a driver is an independent variable that determines a financial dependent variable or outcome.
All amounts on an income statement can be broken down into the number of units of something times the dollar amount per unit. For example:
- Revenue is sales price per unit times units sold
- Production costs are costs per unit multiplied by the units produced
- Cost of goods is units sold times cost per unit
- Salaries costs are the number of staff times annual salaries or the number of hours worked times an hourly wage rate.
Drivers impact the component unit counts and the dollars per unit. These are what lead to the changes in revenue and expense amounts on an income statement.
Accounting types may see a strong resemblance to my definition of drivers and activity cost drivers in activity-based costing. In activity-based costing, resource costs are first allocated to activities. Activity costs are charged to objects based on the number of activities the object “drives” or causes.
Activities can occur at different levels or categories of a company:
| Activity Category | When a Unit of Activity Occurs | Example |
| Unit activities | Occur with each unit produced or sold | Cost of a component part and the labor needed to install it |
| Batch activities | Occur when setting up a production batch, regardless of the number of units produced in the batch | Setup of a production machine for a batch |
| Product activities | Occur for each product, regardless of the batches and units of the product produced | Package design |
| Customer activities | Driven by customer actions and not by the number of units produced | Customer service call |
| Market activities | These occur for a market, regardless of the customers, products, batches, units, etc. | Market-specific marketing campaign |
| Entity-sustaining activities | These are the “cost of doing business” regardless of the amount of business, customers, or markets. | Monthly financial statements, annual tax returns |
These types of activities are a subset of drivers. Drivers are much broader than activities and activity cost drivers. Drivers impact both revenues and expenses. Activities in ABC tend to focus on costs.
Drivers can include external events and conditions. Examples include changes in interest rates, inflation levels, and unemployment. The number of conventions in a city can drive hotel occupancy rates, which flows into hotel revenues and staffing costs. Higher customer satisfaction may drive sales.
Example Driver-Based Forecast
Let’s walk through a very simple driver-based forecast. The company in this example provides outsourced information technology (IT) services.
The key company drivers and assumptions are:
- Revenue: Billable hours and the rate per billable hour
- Salaries: The number of technicians and the monthly compensation per technician.
Some might consider the rates as assumptions rather than drivers. I like a broader definition of drivers that would include these as drivers. Managers have some control over them and may make trade-offs between them. For example, they do a promotion that lowers the price per hour but increases the billable hours to improve profits.
Items that are fixed (e.g., fixed overhead) don’t have drivers. They are forecast at past averages, most recent amounts, or some other simple assumption.
Here’s a simple forecast for this company:
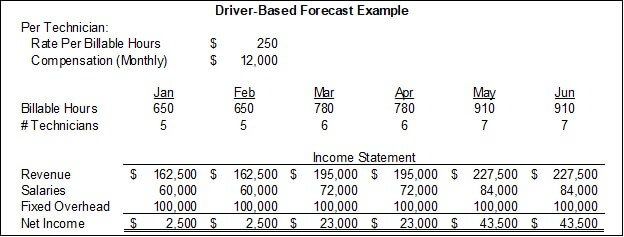
Two drivers that apply to each technician are listed at the top. These amounts apply to all periods. Having only one driver number in the model allows easier modeling and sensitivity testing. However, you may want to enter these drivers for each month to allow variations by month. This can improve accuracy. Both compensation amounts and bill-out rates may increase in future months.
The middle section shows two more drivers. These are set for each month because I did expect them to change from month to month.
I once coached a company that was formed by two co-owners. One managed sales, and the other managed staffing and operations. That operational structure fits this driver structure well. The sales owner would project billable hours and bill-out rates. The staffing owner would forecast the number of technicians and compensation per technician.
The bottom part of the example shows a simple income statement calculated from the drivers. Revenues are calculated as the monthly billable hours multiplied by the per-technician rate per billable hour. Salaries are calculated as the number of technicians multiplied by the per-technician monthly compensation. Fixed overhead isn’t calculated from a driver. It’s assumed to be a flat $100,000 per month.
Here’s another forecast design for the same company:
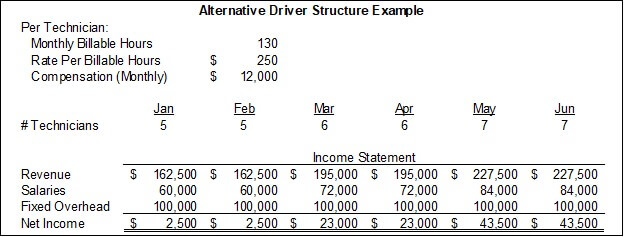
All the outcomes are the same; net income has not changed. The driver logic is structured differently. In this example, the number of technicians drives both costs and billable hours. The monthly amount of billable hours per technician has been added to the top of the analysis. The total billable hours driver that was in the middle section has been removed.
In the first example, the billable hours could be forecast completely independent of the number of technicians. This allows the billable hours per technician to change every month. As noted earlier, this may make sense when one person forecasts revenue drivers and another forecasts cost drivers.
The second example above makes the number of technicians a very powerful driver. It drives both revenues and expenses. This logic might work better when the number of technicians is the main constraint to billable hours. If they hire more technicians, there will be enough market demand to utilize the new technicians fully. In this case, the number of technicians is a powerful driver and KPI.
Another example of this logic is in CPA firms. Partners at CPA firm bring in new business. Every partner is expected to bill out certain hours each month. Thus, each new partner (in place of the # of technicians) drives a salary expense and billable hours.
I created two examples of driver logic to show that it’s very important to understand a company’s business model when setting up how the drivers flow to the income statement. The income statement looks exactly the same in both examples, but the driver logic is very different.
Why Drivers?
Most of the variability in financial performance can be traced to a few key drivers. I’m not saying the world isn’t complex. A vast multitude of factors influence a company. However, all companies have limited planning resources. You’re aiming for enough investment in planning to make good decisions, not to create the perfect plan. Besides, trying to achieve accuracy at extremely high levels in the face of an uncertain future is sheer madness. Higher investments in planning accuracy come with diminishing returns.
A related concept is the Pareto Principle, which states that 80% of the total outcome is driven by 20% of the causes. The implication is that a reasonable projection can be based on a relatively small set of drivers.
Forecasting with drivers places more emphasis on planning efficiency than traditional budgeting. That efficiency frees up the resources for more frequent forecasts. Limited drivers also allow easier modeling of scenarios and sensitivity testing of the drivers.
Companies must balance the accuracy they gain from detailed analysis and the accuracy they gain from timeliness. Annual budgets gain small marginal increases in accuracy from detailed analysis while sacrificing large amounts of accuracy and relevance from a lack of timeliness. Rolling forecasts gain higher accuracy from the timeliness by allowing lower but acceptable levels of analytical accuracy for each forecast.
Imagine scoring budgets and forecasts for their accuracy based on the analytical detail and the accuracy from their timeliness. In the table below, each type of accuracy is graded on a scale of 1-10. Total accuracy could be calculated as the product of those two sources of accuracy.
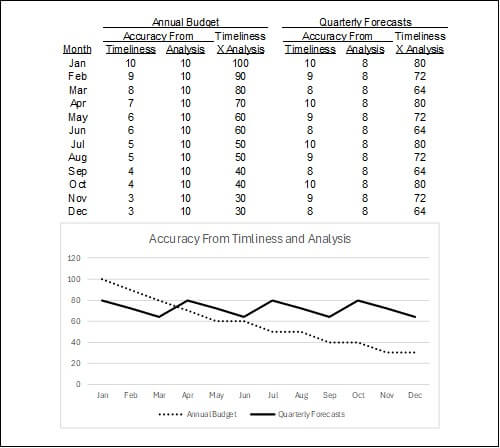
The table shows that budgets have very high analytical accuracy, while forecasts have 80% of that accuracy (in a nod to the Pareto Principle). Timeliness accuracy for budgets starts at ten, drops by one each month until the 5th month, and then drops by one every other month. Timeliness accuracy for forecasts starts at ten and then drops by one each month and then goes back to ten with the next reforecast.
The graph shows how budgets are briefly more accurate than forecasts, but decreases in timeliness soon offset the benefits of initial analytical accuracy.
Note: These scores are for illustration purposes and subjectively set by me. The decay rate of accuracy is different for each company depending on the volatility of their business environment. Feel free to substitute your guesses for scores.
You can make the case that this is the classic CPA-type mistake of an overly numerical analysis. I’m prone to making my point with a big table of numbers followed by a graph to clinch the argument.
The big picture is that budget accuracy starts very high but loses large amounts of accuracy as the year progresses. Forecasts maintain good accuracy throughout the year (and rolling into the future) because of their frequency and timeliness. The efficiency that allows that frequency is gained via drivers.
How to Identify Drivers
Identifying potential drivers is easy. Their importance causes their visibility to operational and financial management. I list the places below where you can find them.
The tougher decision is how many of these drivers to incorporate into the model. Adding drivers exponentially increases model complexity, which reduces efficiency. Once again, you will have to find a balance between efficiency and accuracy.
Here are some places to identify the key drivers:
- Break down the components of revenues and expenses. This is a drill-down from income statement amounts to their causes. Revenue is broken down into sales units and price per unit. If you want to dive deeper, ask further questions. What’s driving the number of units? What’s driving the sales price?
- Companies that have implemented activity-based costing (ABC) have already identified many activities that drive costs. Some of these activities drive a larger percentage of costs than others.
- KPI dashboards are a great source for finding drivers because many KPIs are leading indicators that lead to financial outcomes. For example, the leading indicator of sales calls may be the main driver of later sales units and revenue.
- Companies that have implemented Balanced Scorecards may have also used the related tool of strategy maps. These maps show the flow of what must occur for a company to achieve its strategies. The starting points of these mapped lines may be drivers.
Forecasting Drivers
One way to forecast drivers, at least as a first step, is to extend the regression trendline from past performance. The image below shows the actual units sold from January 20X1 to December 20X1 as a bold line. The regression trendline of those actual amounts is graphed in a dotted line through the actual months and extended into the forecast horizon. This course focuses on the concepts of rolling forecasts, so I’m not getting into the details of how to use Excel to calculate the values of the trendline.
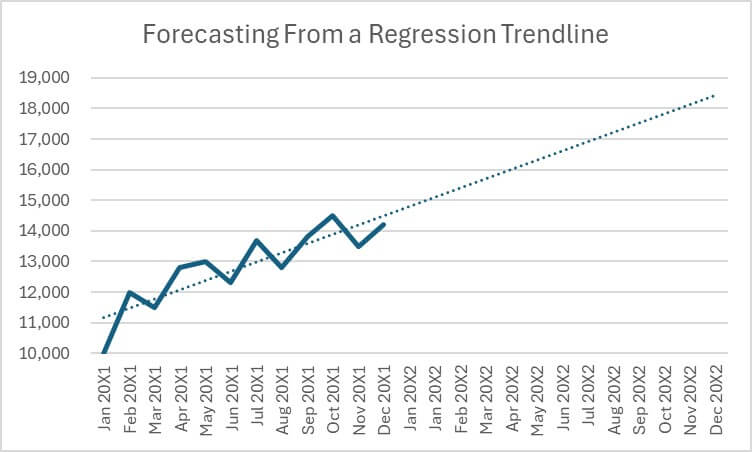
The trendline is linear. Of course, the changes in a driver or the calculation of an amount from a driver may not be simple addition or multiplication. It may be exponential or a mix of fixed and variable components.
The example graph is also a trendline from the past. Future driver amounts may rise above or below that trendline due to changes in company strategy or the business environment. Estimating the impact of those items on the driver’s path along the historical trendline is part of forecasting.
Seasonal businesses will need to incorporate seasonality. They can’t just follow a trendline. In this case, changes in a driver may be best calculated as a combination of the trendline plus the average variance by month from that trendline.
For example, assume that the simple linear trendline amount for June in the forecast period is 50,000 units. Actual June amounts for the past two years have been 13,000 units above the trendline and you expect this to continue. Your forecasted amount for June would then be 50,000+13,0000=63,000. You would repeat this for each month in the projection.
These are just a few examples of ways to forecast numbers. Going through more examples or getting into more detail on any method is a course in itself.
Picking the Driver Point
At what point in a process does one pick the driver?
An internet advertising sales funnel is an example of where one thing leads to another. It starts with the amount of money the company spends on internet advertising. That leads to a number of impressions (i.e., times the ad is shown on the internet). A certain percentage of those impressions are clicked on by the viewer to go to the company’s sales page. A percentage of people who go to the sales page make a purchase. An average number of items purchased per sales transaction and an average price for those items can be calculated. Where are the drivers?
A company could pick any point in the process as the starting driver from which revenue is eventually derived.
The benefit of picking items earlier in the process is that company employees may be more in control of the process. For example, the process started with an ad spend, over which the company had complete control. Yet, a good ad design can increase the click percentage. Good sales page design can increase the odds of a purchase and the amount of the purchase. The company has varying levels of control throughout the process.
The problem with points earlier in the process is that each step of the process is an assumption and calculation that ultimately arrives at revenue. Inaccuracies in the assumptions across the levels are compounded to reach revenue.
Driver Benefits Beyond Modeling
Time spent understanding drivers and their relationship to business performance is time well spent. Think of drivers as operational leverage points. Leverage magnifies the output force of an input. As such, investments in these points have greater returns than in other areas. Scarce monitoring resources can be focused on these key driver areas rather than wasted across less important areas.
The effectiveness of any point in a process is contingent on the effectiveness of the points before it. Drivers are often an early point in a process that determines the effectiveness of all subsequent points. Once again, this means investments and maintenance of these drivers will flow throughout the process unless some later process acts as a constraint.
For more info, check out these topics pages: