For business environmental analysis, a company may just compare historical common-size financials to their competitor or industry. Of course, you don’t want to just dump a page full of numbers on the company leaders conducting the analysis or strategic planning. You want to highlight the key items and point out their implications.
This may involve projecting financial statements into the future of the company, competitors, or the industry. This can be quickly done with common-size analysis.
Using Vertical Analysis for Projections
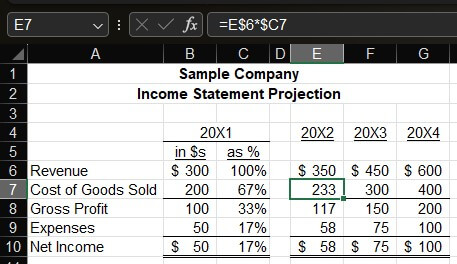
The above image is a three-year income statement projection. A company could prepare a projection like this for itself or for one of its competitors. The income statement in column B has been converted into a common-size statement in column C. The base number is total income. The formula for the common-size Cost of Goods Sold (cell C7) is B7/$B$6.
Income statement amounts for the next three years can be quickly estimated based on the common-size percentages. A revenue assumption is entered in row 6 for the next three years. All other numbers are calculated as their ratio to that base income number based on the percentages in row C. For example, the formula for revenue in 20X2 (cell E7) is E$6*$C7. In other words, that formula is 20X2’s revenue times the percentage of the cost of goods to revenue in 20X1. This is a way to project numbers with a single year’s common-size income statement.
Trending off of one year may not provide enough historical data upon which to make a trended projection. Here’s five years of data:
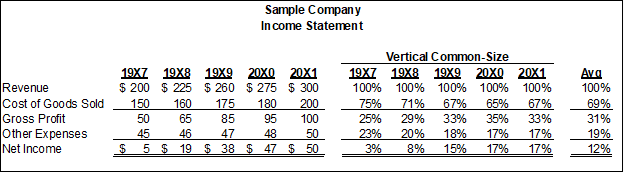
I calculated a common-size income statement for each year. The average percentages for each line of the common-size statements over the five years are on the far right.
The company may decide to use the five-year average percentages for a projection instead of just the past year’s percentages. Here’s the three-year projection I showed earlier but using the five-year average percentages:
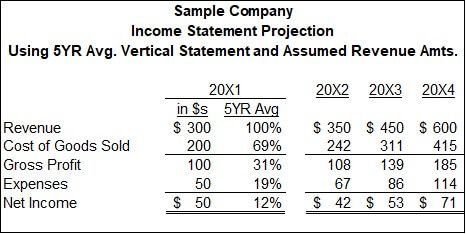
The starting numbers are the same as before, but the projected amounts are different because I used different vertical common-size assumptions.
This can be used as the starting point for a more refined projection. The cost of goods for the three projected years could be manually revised in an upward trend if the company thinks cost pressures will continue to increase over the next few years. Another option to layer trending line-by-line in projections is by horizontal common-size analysis.
Using Horizontal Analysis for Projections
Horizontal analysis is an excellent way to make projections for each line of an income statement. Here’s the five-year income statement I showed earlier, but now with horizontal analysis on the right half of the image.
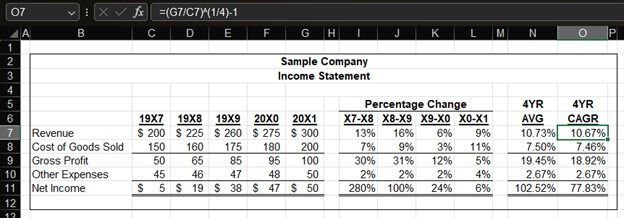
I’m showing the column titles, row titles, and the formula bar because we need to talk a little bit about math. I’ll try to make it quick and painless. Each cell in columns I-L shows the percentage increase of each line from the previous year. The formula for cell I7, which is the percentage increase of revenue from 19X7 to 19X8, is (D7-C7)/C7.
The far-right columns show two options for calculating increases over a longer time period. Column N is a simple average of columns I-L for each line. The formula for cell N7 is AVERAGE(I7:L7). Column O calculates the compound annual growth rate (CAGR) to get from 19X7 amounts to 20X1 amounts. The formula for cell O7 is in the formula bar. I extended the decimal out two places for columns N and O to show that the numbers are slightly different when growth rates are steady. Cells N11 and O11 show that the two numbers can be very different when there is large volatility. I don’t recommend trending off of net lines like this, which I’ll explain later.
Which percentage change numbers should you use for a projection? Here are some options and times they may be most useful:
Change from the previous year
An example of this would be to project future revenue using the 9% revenue change from 20X0 to 20X1 (cell L7). This is best if you think recent trends best represent future trends.
Average of changes from multiple years
An example of this would be to project future revenue using the 10.73% average of the past four years’ change in revenue (cell N7). This is good for an item that changes each year, especially in a general trendline over multiple years, but the magnitude of that change greatly varies each year. The average of the past years is also good if you don’t think the numbers of the first or last years are good representations of trends. You don’t want to use the CAGR, which I’ll explain next.
Compound Annual Growth Rate (CAGR)
The CAGR is most effective when you think the starting and ending numbers are good representations of the trend for a line item. CAGR is calculated from a start amount and an end amount; it’s blind to percentage changes between those points. The starting and ending revenue amounts for this company seem reasonable compared to the general trend of revenues across all five years.
What if this company had a one-time spike in revenue in 20X1, and you expect future years to follow the trend of 19X7 to 20X0? Don’t use the CAGR for the period ending 20X1. You have a few options:
- Use the CAGR from 19X7 to 20X0
- Deduct the one-time revenue amount from 20X1 and calculate the 19X7 to 20X1 CAGR using that adjusted revenue amount
- Use the simple average from 19X7 to 20X0
Here’s an example of using the four-year CAGR rates for a projection:
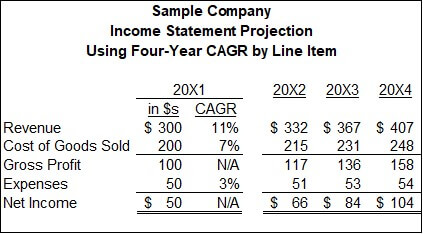
You’ll notice that I don’t list the CAGR rates for Gross Profit and Net Income. Those amounts should be calculated each year from the other projected amounts (i.e., revenue, COGS, and expenses).
Using Horizontal Analysis and Vertical Analysis
The projected amounts in my vertical analysis examples were very different than the projected amounts in my horizontal analysis example. Why? The projected revenue amounts in my vertical examples were completely made up. You may counter that all the numbers in this course were ones I made up for a company I made up. You have a point.
Let’s say that I was analyzing a real company for which I had real historical numbers. I want to make a quick but reasonably accurate projection. I may want to start with a horizontal analysis of a key line item and then do a vertical analysis from there.
First, here’s a quick recap of good times to use vertical or horizontal analysis:
- Vertical: Vertical is great for making quick and easy projections. You may want to use this for modeling and scenario analysis. You only need at least one year of a historical statement and a good estimate for one key line item. Everything is calculated from that.
- Horizontal: Horizontal is better for detailed projections for each line item. It’s better for detailed analysis, like a budget. The assumption in vertical projections that relationships between line items remain stable may be incorrect. Each line item may have unique factors driving them. Those factors may be identified or reflected in historical horizontal analysis.
Projected revenue amounts may reflect insights into future revenue that aren’t reflected in historical trends. For example, I may know that a new product line is rolling out, which will greatly increase future revenue. Sometimes, future amounts are simple trends based on the past. I just picked the vertical analysis projected revenue amounts out of thin air when I wrote this lesson.
Of course, no good analysts would want to be caught randomly picking their key assumptions out of the air. Their assumptions would be firmly grounded in historical amounts as adjusted for likely changes in those amounts and their trend. Such an analyst would perform a historical analysis of revenue. If they then wanted to use vertical analysis for a quick projection, they would do the vertical analysis as I showed above but use revenue numbers based on their horizontal analysis as adjusted for other insights about future revenue.
Long story short, I used poor assumption development to make my point more clear in this lesson. It was all part of my plan.
For more info, check out these topics pages: