We live in an uncertain world with imperfect information. Sources of information, such as market tests, customer surveys, and economic projections, all have very objective costs. Should we invest time and money in gathering this information? Can we calculate the value of imperfect information to compare to its cost?
Calculating the Value of Imperfect Information
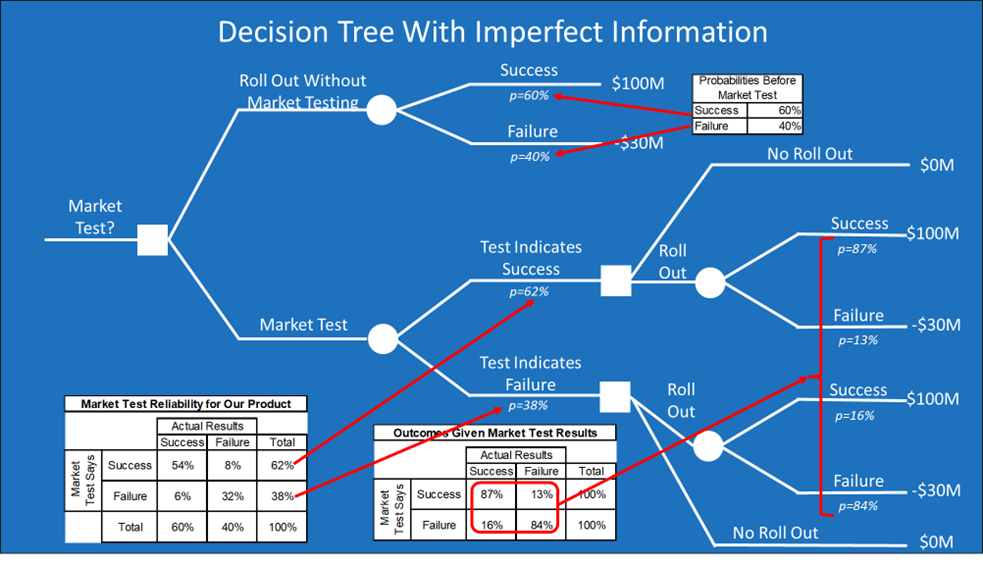
Let’s return to our example of deciding whether to roll out a new product. Here are the probabilities of success before the market test:
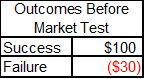
Here are the projected outcomes before the market test:
We have the opportunity to do market testing. Of course, market test information is not perfect. However, it may help us decide whether to roll out the new product. How much would we be willing to pay for the market test information?
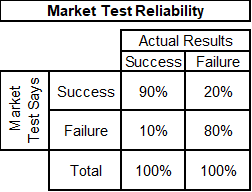
Let’s assume that the market testing company allows us to see their past test results compared to actual results. Here is what has happened, which we expect to hold true as probabilities for our market test:
- When a product was actually successful, the market test correctly indicated success 90% of the time. Conversely, 10% of the time when a product was a success, the market test incorrectly indicated failure.
- When a product was actually a failure, the market test correctly indicated failure 80% of the time. Conversely, 20% of the time when a product was a failure, the market test incorrectly indicated success. Below is a table summarizing these two bullets.
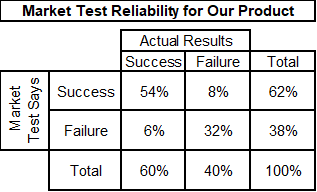
We can now calculate the market test reliability for our product. There are four possibilities:
- The market test indicates success and the product is actually successful: This is calculated as the 60% probability of actual success multiplied by the 90% probability that the test indicates success when the product is actually successful. 60% X 90% = 54%.
- The market test indicates success and the product is actually a failure: This is calculated as the 40% probability of actual failure multiplied by the 20% probability that the test indicates success when the product is actually a failure. 40% X 20% = 8%.
- The market test indicates failure and the product is actually successful: This is calculated as the 60% probability of actual success multiplied by the 10% probability that the test indicates failure when the product is actually successful. 60% X 10% = 6%.
- The market test indicates failure and the product is actually a failure: This is calculated as the 40% probability of actual failure multiplied by the 80% probability that the test indicates failure when the product is actually a failure. 40% X 80% = 32%. Below is a table that summarizes these four bullets.
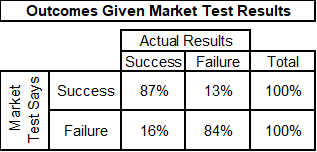
We have one more table of probabilities to calculate. This is the probability of product outcomes given market test results. We once again have a matrix of four possibilities. The probability of the product’s success given a market test indicating success is the 54% calculated above (i.e., the product is a success and the test said it would be a success) divided by the 62% of the time that the market test indicated success. This equals 87%. Similar logic can be used to calculate the four boxes to create the table below.
We’ve strung together a lot of tables. You may be wondering if there is just a formula I could give you to get to this last table. I’m so glad you asked. We are reunited with Bayes’ theorem.
Here are the components for the formula:
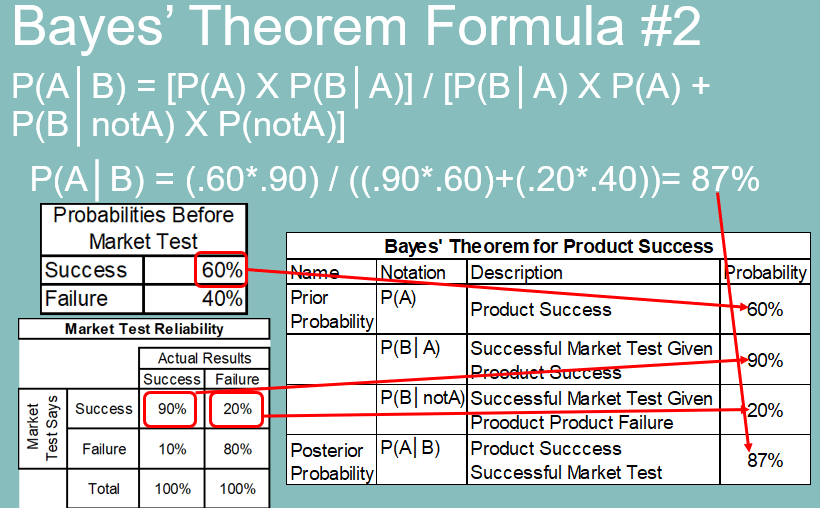
Let’s revisit Formula #2 for Bayes’ theorem: P(A│B) = [P(A) X P(B│A)] / [P(B│A) X P(A) + P(B│notA) X P(notA)].
Using the numbers from above, that’s: (.60*.90) / ((.90*.60)+(.20*.40)) = 87%
Before the market test, we thought the product had a 60% chance of success. A market test indicating success would increase that probability to 87%. We don’t have perfect information, but an 87% probability is very high.
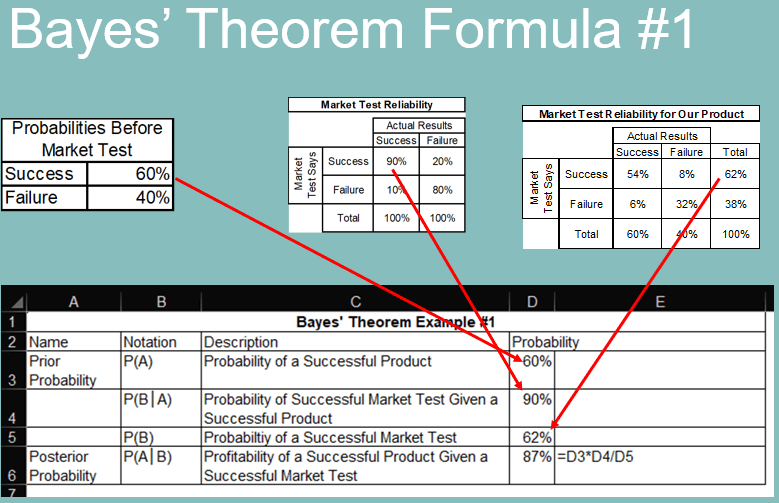
The example I used in an earlier lesson on Bayes’ theorem formula #1 actually came from this lesson’s example. At the beginning, we didn’t know the probability of a market test indicating success, so we used formula #2 above and a series of calculations. Now, with the tables in this lesson, we have calculated that to be 62%. You can see it in the top row of the market test reliability table. With that, we can revisit the formula #1 example from the Bayesian logic lesson to get the same probability of success:
All the tables I have been building and the decision tree I will soon solve are based on Bayesian logic.
Calculating the Expected Values After Imperfect Information
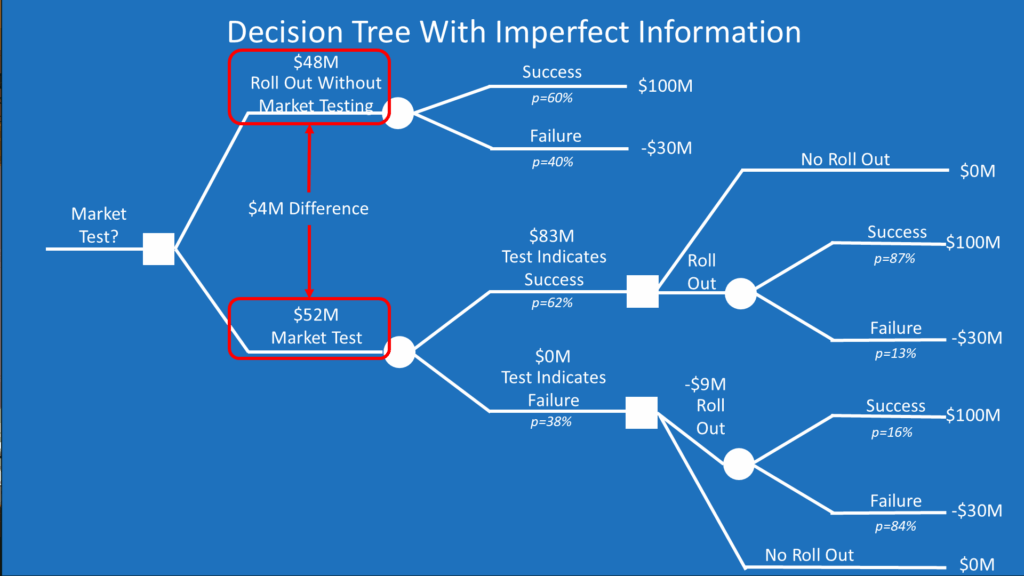
You’re probably tired of probabilities by now (yes, that was a bad statistics joke). The good news is that we can start calculating expected value amounts. We’ll use a decision tree to do this.
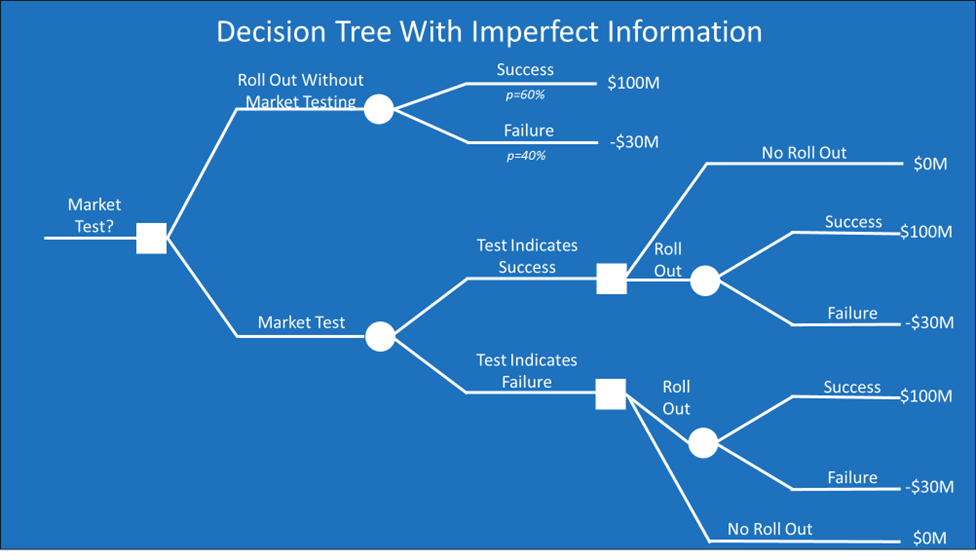
The logic of the tree and the series of decisions flows from left to right. Our first decision is whether to conduct the market test. For simplicity, I assumed at the top of the tree that we would automatically roll out the product if we didn’t do the market test. Of course, we could also not do the market test and not roll out the product. Performing the market test leads to two uncertain outcomes: the test could indicate success or failure. With either test result, we must decide whether to roll out the product.
The next step of building the tree is to add the probabilities that we calculated. The table of the market test reliability for our product is assigned to the uncertainties of whether the test will indicate success or failure for the product. The table of outcomes given market test results goes to the branches on the far right side of the decision tree.
We now solve for the expected values, going from the right to the left of the tree. We start with the “leaves” of the tree on the right side of the diagram.
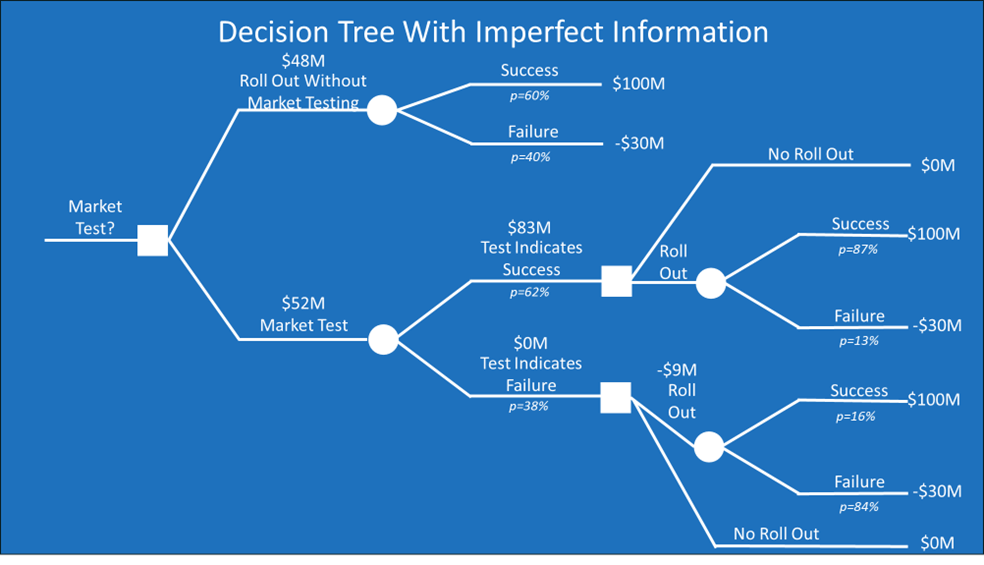
A successful product has a net present value (NPV) of $100 million and a failure cost of $30 million. Expected value is calculated as the weighted average of possible outcomes. At the top of the tree (i.e., we roll out the product without market testing), there is a 60% probability of a $100 million success and a 40% probability of a $30 million loss. The expected value is calculated as 60% X $100M + 40% X -$30M = $48M.
The expected value of not market testing and not rolling out the product is $0 because we did nothing. This is obviously much smaller than the $48 million expected value of rolling out the product, which is why I cut that branch off before drawing the tree due to space constraints of the page.
Similarly, the expected value calculation of rolling out the product after a successful market test is 87% X $100M + 13% X -$30M = $83M. This is much higher than the $0 expected value of not rolling out the product, which is an option I show on the tree, so the expected value of a successful test leading to a product rollout is the $83 million.
If the test indicates a product failure, rolling out the product has a negative expected value. We would not roll out the product, which has an expected value of $0.
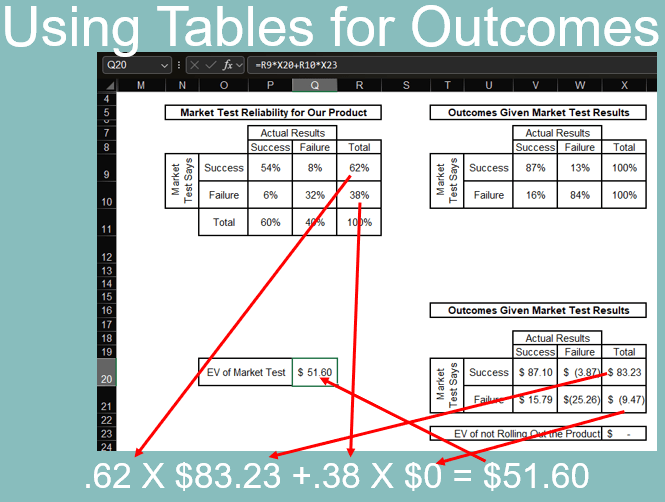
Rather than using the decision tree to calculate the expected values of the outcomes, we could also use the tables. The bottom table in the image below does this. The amounts in Cells X20 and X21 match the expected values in the decision tree. The formula for Cell V20 is shown in the formula bar at the top of the image. You can use a similar formula for the other cells in the table.
The expected value of the market test is the weighted average of the expected values of the test indications. This is calculated as 62% X $83 + 38% X $0M = $52M. This can be calculated with the decision tree above or the tables below. The formula for Cell Q20, which is the EV of the market test, is in the formula bar at the top of the image.
We are now ready to answer our initial question. The expected value of not performing the market test is $48 million, and the expected value of performing the test is $52 million. The $4 million difference is the value of testing.
To beat a dead horse, that’s the economic value. Decision makers hate the unknown, so if the marketing company demanded $4.5 million for the test, management might still agree to reduce uncertainty to help them sleep at night. If nothing else, they can now blame the marketing company for bad information if they roll out the product and it fails. Failure is still a statistical possibility in an uncertain world with imperfect information. Maybe someday I’ll write a course on the value of a scapegoat.
Discover the Odds and Amount of the Money you Could Gain – or Lose
For more info, check out these topics pages: