Some companies lose large amounts of profit from rampant discounting or discounting without analyzing its impacts. It reminds me of the famous Walt Kelly quip, “We have met the enemy and he is us.”
Finding these profit leaks may be one of the best ways to improve pricing discipline and profits. A fair discounting process will improve customer satisfaction and employee morale. Repeatedly buckling under pressure to give discounts trains customers to press harder and harder for discounts.
This chapter focuses on discounts provided to individual customers on negotiated sales. This may not apply to retail sales in which almost all customers are offered and pay only one price. However, there are times when the discounting dynamics I describe are done for retail goods.
Discounting is a function of focusing on revenue instead of profits. Some companies or departments are focused on revenue and “getting the deal” by culture and by compensation. This lesson will tackle rampant discounting via both analysis and challenging a culture that underemphasizes margin.
Not All Business is Good Business
I’ll begin by challenging a common justification for discounting. People often say they had to discount because of their competitors’ crazy low pricing. One or more competitors may be pricing irrationally. A company has to decide whether to chase fools or follow their strategy. It’s often greater madness to chase fools to the long-term detriment of profitability and company sustainability.
Is a company willing to let customers go to protect its long-term profitability? Do these companies know what profit margin is their stopping point for prices? Is pricing instead based on revenue or rules of thumb?
A huge percentage of customers may be unprofitable for a business. This was made famous by a Harvard Business Review article that popularized the 20:225 rule.
The article presented a case study of a company where 20% of the customers were the source of 225% of the profits. This means the total profit of the other 80% was massively negative. Each wasn’t likely unprofitable, but either many were or there were a few extremely unprofitable customers.
This is similar to the oft-quoted Pareto Principle, where 20% of customers provide 80% of the profit. If the 20:225 rule is more prevalent, the Pareto Principal may understate the power of the most and least profitable customers.
Value-Based Pricing or Competition-Based Pricing?
A company may think it’s utilizing value-based pricing, but discounts tactically unravel that strategy to competition-based pricing. This brings many of the disadvantages of competition-driven pricing I mentioned earlier in this article. These include:
- Profitability Challenges
- Lack of differentiation
- Limited strategic control
- Price battles
- Market myopia
Graphing Prices
One way to get a high-level view of discounting is to graph the prices on sales. A wide range of prices isn’t always bad. It may be due to pricing for volume discounts. The plot graph can show whether pricing is correlated to volume or some other aspect of policy or whether it’s correlated with something else, like certain people who are improperly generous with discounts.
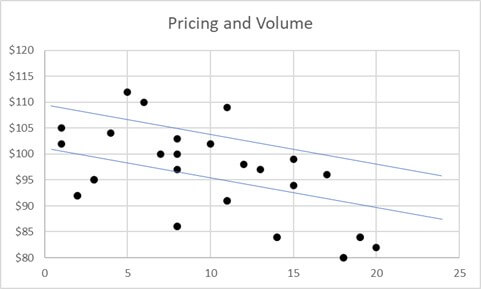
Here’s an Excel XY Scatter plot of an imaginary company called Sample Company. I know that’s a silly name, but I used all the creative brain power I have to develop these graphs. They try to sell their product at around $100. Their target price is a little above $100 for small orders, with discounts for higher volumes. The blue lines represent the upper and lower bounds of their intended pricing policy.
It’s clear they have some outliers to their intended pricing. This graph alone may show management that the total discounting is much larger than anticipated in both frequency and magnitude.
One course of action is to research the outliers to find out what’s happening. Management may want to look at total customer sales vs units of a particular product if pricing is based on the full customer relationship.
I created a customer profitability system at a bank in the late 1990s. We calculated the profit by customers. We could break their profit down by account. It shattered the myth that larger customers were the most profitable customers.
A company could graph customer profit by customer size. It may discover that the largest customers have extremely low profits. Price concessions are made on every purchase so that a decent margin is never achieved. This would happen in banking with real estate investors who received very low loan rates but provided very few deposits, which are highly profitable.
A small tweak to the graph could add a great deal of information. We could plot discounts by salesperson. Certain salespeople might give discounts much more frequently than others. This can be graphed by using different colored dots on the plot graph.
Before I do that, here’s a quick summary table of the sales by each person. Sample company has three salespeople who go by the clever nicknames of A, B, and C.
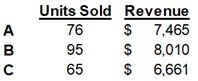
Salesperson B is the big hitter. They have the most units sold and the most revenue. They are going to get the biggest bonus. They also have bragging rights to selling the three biggest orders the company has received. Person A’s performance is good. Person C’s performance looks questionable. Now let’s look at the graph by salesperson.
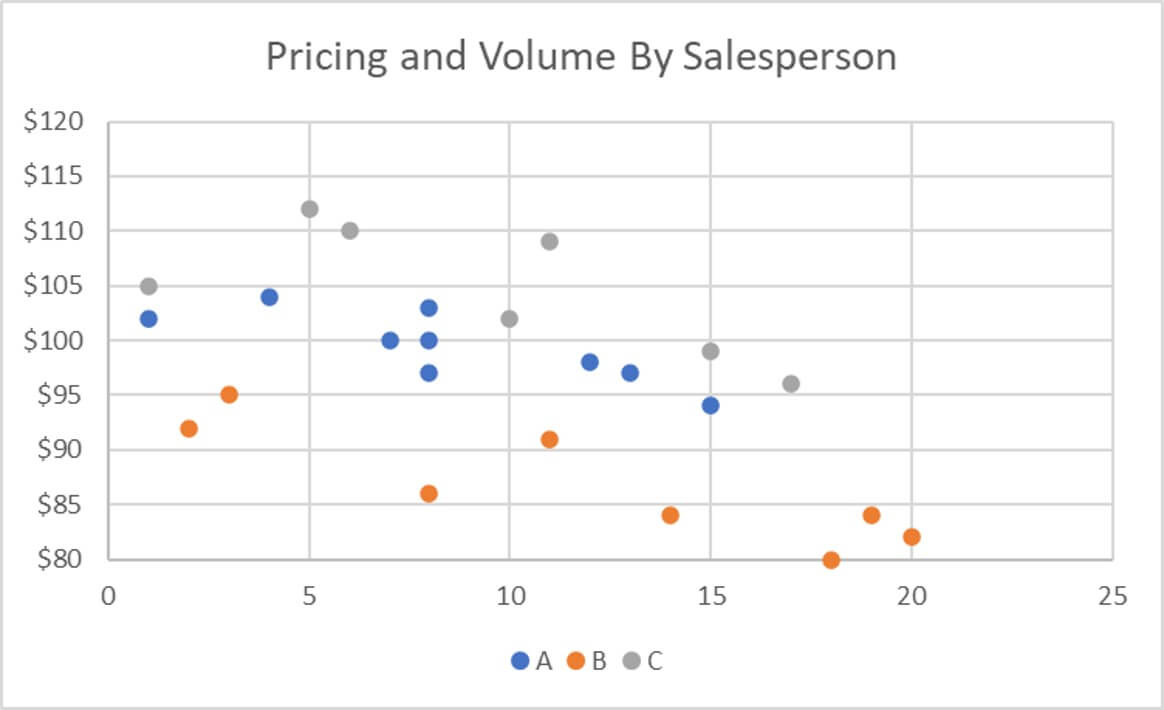
We now see some troubling patterns by person. Person A is sticking very closely to the pricing policy. They don’t give big discounts, but they also don’t get many sales that are high above the target price.
Person B’s pricing is shocking. They are consistently handing out discounts. They may do a better job selling managers to authorize exception pricing than they do selling to customers.
Person C is consistently getting very high prices. This isn’t always good. They may be pricing too aggressively. They are violating policy as much as Person B. They may be losing profitable deals. On the other hand, they may be closer to an optimum price than Person A and the policy. The company would need to do some marginal profitability analysis and review the sensitivity of customers to price increases to check this.
Plotting revenue is good but doesn’t capture costs and margins. Even the same product may be bundled with services and other add-ons. They change the price and the margin. This is incredibly important because salespeople may waive revenue to get a deal, but the company may bear significant costs for those services.
Here’s a table of margins for each salesperson, assuming an $85 cost per unit:
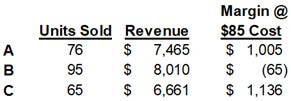
The margin for Person A and C is very close. Person B’s performance now looks very poor.
You could create the earlier graphs using margin instead of revenue. The simple assumption I used of $85 per unit just shifts all the points down $85 with no change in their relationship to each other. Your costs may vary significantly based on order size or which add-ons are bundled into each sale. This would make a graph on margins look much different than a graph on revenues.
I obviously created data to make a point. I will say that I’ve created reports that allowed managers to step back and see patterns. Pricing exceptions are often made one by one with little tracking. These graphs allow a bigger picture.
Price Waterfalls (a.k.a. Pocket Price Waterfall)
Price waterfalls are an effective way to see how discounts unravel a company’s pricing strategy. The price waterfall is a graphical display to show the difference between the list price for a product and the price a customer actually paid. McKinsey and Company developed it. The price a customer actually paid is called the “pocket price.” The difference between the list price and the pocket price is the pocket discount.
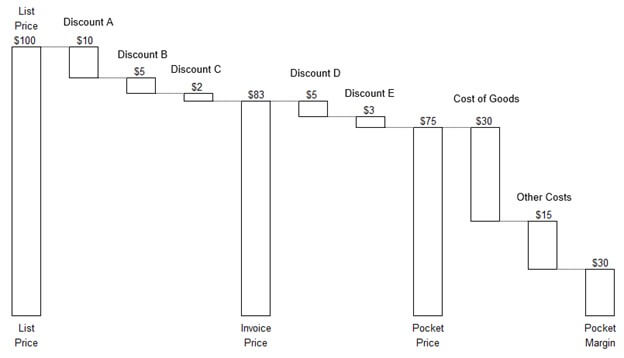
The example waterfall in the image starts with a $100 list price. The customer then receives a series of discounts to arrive at an invoice price of $83. These discounts might be for volume discounts, exception pricing to match a competitor, or one of many other discounts. The customer also receives other off-invoice discounts to arrive at a pocket price of $75. Off-invoice discounts include cash discounts or an annual volume bonus to the customer. The pocket price is reduced by the cost of goods and other costs to arrive at the pocket margin. Other costs might include servicing costs, sales costs, or shipping costs.
A price waterfall tracks the layers of discounts received by a single customer. The map of discounts for all customers is summarized in the plot graphs discussed earlier. A company may identify some customers who received outlier pricing via a plot graph and then build price waterfalls for those invoices to identify the specific reasons for the low pricing.
The systemic question is whether the pocket discounts were derived from a well-developed strategy or are a series of ad-hoc defensive measures with little linkage to an agreed-upon pricing strategy. The discounts may have been given or authorized by a variety of people. The total of the discounts may not have been coordinated.
Rather than raising list prices, often the best way to improve pricing is to find the profit leaks cascading down the price waterfall. Price waterfalls create visibility to the cumulative effect of discounts and their impact on profitability. This creates the motivation for greater accountability to pricing policies or improvements to the policies.
If profitability analysis done by Finance used list price as assumptions, then those profitability calculations were inaccurately optimistic. This is one reason why actual profitability for a product may be well below the projections made when deciding when to produce and sell the product. It’s hard to anticipate all the discounts that will be granted.
When modeling future products, this discounting must be included. In banking, we would give a “haircut” to appraisal amounts when making loans. This meant reducing the appraisal amount to arrive at a number that we used for loan analysis and decisions. List prices may need a “haircut” to match reality. The discounts represent only a trim at some companies. Other companies may be giving buzz-cut size discounts.
The Ones That Got Away
Plot graphs and price waterfalls are excellent visual ways to analyze pricing, yet both are missing a set of very important data points. They don’t show the prices and margin on the sales that didn’t happen. It’s hard to know how many retail sales didn’t occur because of pricing. Sales staff can track the times they have given bids but haven’t gotten the deal.
A company can track the prices and margins on the deals they got versus the ones they didn’t get. This helps build data points for analyzing the price sensitivity of customers. In other words, what is the general likelihood of getting a deal at a given price? If we lower the price, how much does the probability of a sale go up? Do the higher win rates compensate for the reduced prices? I go into more detail on pricing analysis in my Pricing Profitability Analysis course.
Patterns may emerge that show which discounts are more important to winning or losing deals.
One note of caution is that two bids at the same price could have vastly different probabilities of leading to a sale because of how each customer is using the bid. A customer may just be getting bids to force their favorite vendor to reduce prices.
Reducing Ineffective Discounting
Sometimes customers are given discounts with no change in the product. Price has implicitly become the ground for negotiation. Instead of discounts, companies can remove value from the product and reduce the price to find a better value-to-price ratio for the client. Two options include:
- Reduce product features that the customer doesn’t value. This reduces the cost of delivering the product and the price, which maintains profitability.
- Reduce the price and remove an item the customer values. The customer then must decide whether they really want a lower price or are willing to pay for value. Either way, the company maintains profitability.
Giving each salesperson a discount budget can reduce overall discounting and make the amount of discounts amongst salespeople more equal. It also improves the accuracy of the overall company budget. The budget could be a fixed dollar amount or a percentage of list pricing. If using a fixed dollar, many salespeople won’t use all of the budget because they keep some in reserve.
A more extreme option is to publish discount percentages by salesperson to all sales staff. This will definitely promote equality of discounting in one of two ways:
- The biggest discounters might be shamed into fewer discounts
- Those offering fewer discounts might start offering more discounts if large discounting is considered the “fair” amount for a person to use.
If discounting tends toward the latter bullet, it will force managers to strengthen the policy and potentially set discount budgets. Publishing discount percentages obviously must match a company’s culture and the amount of other information shared about each salesperson.
One of the biggest causes of discounting is not by a salesperson but by a senior manager who gets nervous at the end of a month or a quarter. Customers may anticipate this weakness and try to exploit it. Sometimes, customers have learned from experience that this works. They defer purchases until the end of the period and push hard for discounts. They constantly try to go above the salesperson.
The senior person who does this must be reined in by their supervisor or the CEO. The CEO enforces compliance with policy and may enlist the help of the pricing committee or the CFO. Not following the pricing policy puts the pricing strategy back at square one.
For more info, check out these topics pages: