Budget variance analysis is just the price and volume analysis we did when creating the budget, but in reverse. When budgeting, we assumed a price and a volume and then derived the budgeted revenue/cost/profit.
In budget-to-actual reporting, we often first look at the profit/revenue/cost. We then break out the price/cost and volumes to compare them to the budgeted price/cost and volume. We’re breaking down a total budget variance by the price (or cost) variance and the volume variance.
An income statement is just a list of rows where each row is one category of items times the dollar amount of each of those items. Activity-based costing breaks expenses down to the number of activities times cost. Every invoice, sent or received, is a number of units times the cost. Every payroll is a number of wage units (hours or salary periods) times the wage amount. It’s all unit counts times unit dollars, repeated on and on.
For example, revenue can be broken into a price and volume variance.
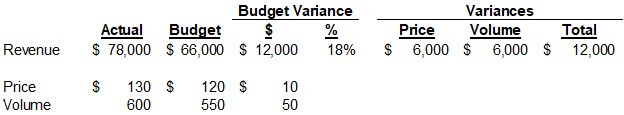
In the above example, the actual revenue is $78,000, and the budgeted revenue is $66,000. This was driven by an actual price that was $10 higher than budgeted ($130 vs. $120) and a volume that was 50 units higher than budgeted (600 units vs. 550 units).
The $12,000 budget variance is comprised of a $6,000 price variance and a $6,000 volume variance. The price variance is calculated as follows:
(Actual Price – Budgeted Price) X Actual Volume = Price Variance
($130 – $120) X 600 = $6,000
The volume variance is calculated as follows:
(Actual Volume – Budgeted Volume) X Budgeted Price = Volume Variance
(600 – 550) X $120 = $6,000
The difference in revenue and the component variances would have been two points on a data table. Here’s an example data table that might have been developed when modeling revenue:
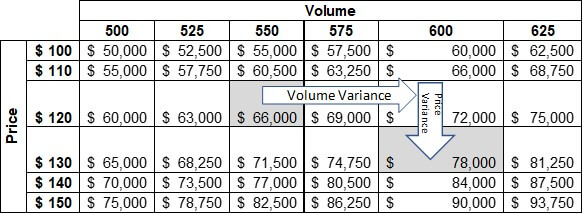
The budgeted revenue is at the intersection of the 550 units volume column and the $120 unit price row. The $6,000 volume variance was modeled as moving two columns right, from $66,000 of revenue in the 550 units column to $72,000 of revenue in the 600 units column. The $6,000 price variance was modeled as moving one row down, from $72,000 of revenue at 600 units and $120 per unit to $78,000 of revenue in the $130 per unit price row. This visual depiction of price and volume variances may help some of you better grasp what budget variances represent.
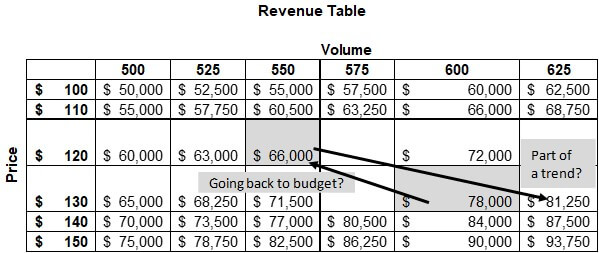
That explains how we got from budget to actual. The big question is where it goes from here. For example:
- Was this month an anomaly, so next month goes back close to our budget?
- Or was this month part of a trend that will go even further next month?
To revisit the questions from the beginning:
- What happened? Revenue was $12,000 above budget.
- Why did that happen? Prices were $10 above budget, and volumes were 50 units above budget.
- What does this mean? If it’s part of a trend, our production will need to be higher than budgeted. Absent step costs, this could mean profits and cash flow will be higher than anticipated. That will involve changes to purchasing, staffing, and opportunities for cash investment. If we are just going back to the budget, we could continue operations as budgeted while seeking to replicate the increase in performance we achieved during this period.
I’ve read, and admittedly written, many budget variance narratives that only state the first two bullets above. This is exactly correct but almost completely worthless. We have to keep digging for what this means for the future.
The five whys method is one way to drill into “Why did this happen?” to get to “What does this mean?” In the five whys method, you start with a statement, ask why, arrive at another statement, ask why again, and then continue this loop until you arrive at the root of a problem. The “five whys” name comes from asking “why” not once but five times (or more) to eventually get to the real answer.
You’re starting from an outcome and working back through the cause-and-effect relationships to find the cause most responsible for the observed outcome.
Here’s a way to apply the five whys to our recent revenue example:
Revenue was $12,000 above budget.
Why?
The average price per unit was $10 higher than the budget.
Why?
We sold a higher percentage of our high-price products vs. low-price products than budgeted.
Why?
Our main competitor was out of the competing product.
Why?
They couldn’t get a key part for the product.
Why?
The supplier of the part had a major fire that halted production.
There were two answers to the first why question about revenue being $12,000 above budget. The price per unit was above budget and the number of units was above budget. We could have asked multiple “whys” about the number of units in addition to the ones above. In other words, you may chase down many paths, asking “why” until you find the root cause. It’s not linear.
A thorough budget variance analysis would follow these cause-and-effect relationships to uncover the key drivers of the variances. Management then needs to decide what to do.
Once again, you’re asking why something happened to understand what may and should happen in the future. The “What does this mean?” question includes the question, “Should we do anything to have more/less of what happened?”
In the example above, management would want to assess their vulnerability to the same supplier. If they are vulnerable, they need to take steps to avoid running out of the product themselves. If they aren’t vulnerable, management may decide to heavily market the product to the competitor’s customers while the competitor can’t easily respond.
If you want to learn other ideas on how to make your business budgeting process more effective, check out my Better Budgeting course.
For more info, check out these topics pages: