How much inventory should we order? When should we order that inventory? Are there ways to reduce our inventory for better working capital management? I’ll answer these questions in this lesson.
Goals of Inventory Management
There are basically two main goals regarding the working capital management of inventory:
- Avoiding too much inventory: Excess cash in inventory is wasted cash that could be earning something. Excess inventory can also lead to higher obsolescence and spoilage. It also increases storage costs.
- Avoiding stockouts: A stockout is when a company doesn’t have the inventory that customers are ready to buy. This leads to lost sales and profits. It also causes customer dissatisfaction.
We’ll now look at ways to calculate how much inventory a company should have.
Economic Order Quantity
The economic order quantity (EOQ) calculates the amount of inventory to order at a time. It optimizes (i.e., balances) ordering costs and holding costs. The formula is: √(2DS/H) where:
- D = Annual demand
- S = Ordering costs
- H = Annual holding costs
Most finance types do all their calculations in Excel, in which case you can use one of the following formulas:
- =SQRT(2DS/H)
- =(2DS/H)^(1/2)
Imagine that I run an incredibly lucrative pencil company. I sell 1,000 pencils per year. Each order costs $30. I bear $100 of holding costs per year. My EOQ is √((2 X 100 X $30) / $50) = 35 units (rounded).
The EOQ tends to have the following outcomes:
- High-value inventory items should be ordered frequently, and few should be kept on hand.
- Low-value inventory items should be ordered infrequently, with a large stock on hand.
Estimating Demand
The economic order quantity formula has annual demand as an input (i.e., an assumption). How can demand be forecast? Some options are:
- Simple average: The average of past months is the average for future months
- Moving average: The average of recent months is used for future months
- Exponential smoothing: Exponential smoothing calculates a weighted average of past data where recent data is weighted more than past data. The “exponential” in the name is because data is weighted exponentially less the further it lies in the past.
- Forecasted trendline: A regression line is drawn through the past amounts and extended into the future.
- Forecast with seasonality: A seasonal factor is added or subtracted to the trendline for each month based on past variances to the regression line.
To learn how to quickly and easily make these calculations in Excel, please check out my course titled “Modeling Profitability and Making Forecasts in Excel.”
Reorder Point
The economic order quantity tells us how much to order. The reorder point (ROP) tells us when to place an order. It is calculated as the average sales per day x lead time in days + safety stock. The safety stock is the minimum inventory to always have on hand to avoid stockouts.
Let’s now calculate the reorder point for my pencil empire. I said earlier that I sell 1,000 pencils per year. One thousand pencils divided by 365 days in the year equals 2.74 pencils per day on average. Note that you want to divide your annual demand by the actual number of days you make sales. If you only sell five days a week, you would divide by roughly 260 days.
My pencils are hand-lathed and whittled by a toothless couple deep in the backwoods. They can deliver my pencils in 14 days (God willing, and the creek don’t rise).
I always keep 314 pencils on hand because there is always the chance of a demand spike during the back-to-school season or if my pencils receive a favorable mention in the Journal of Accountancy.
My reorder point is: 2.74 X 14 + 314 = 352 pencils.
A Quick Recap of Inventory Levels
Let’s recap how the concepts so far fit together. They are summarized in the image below.
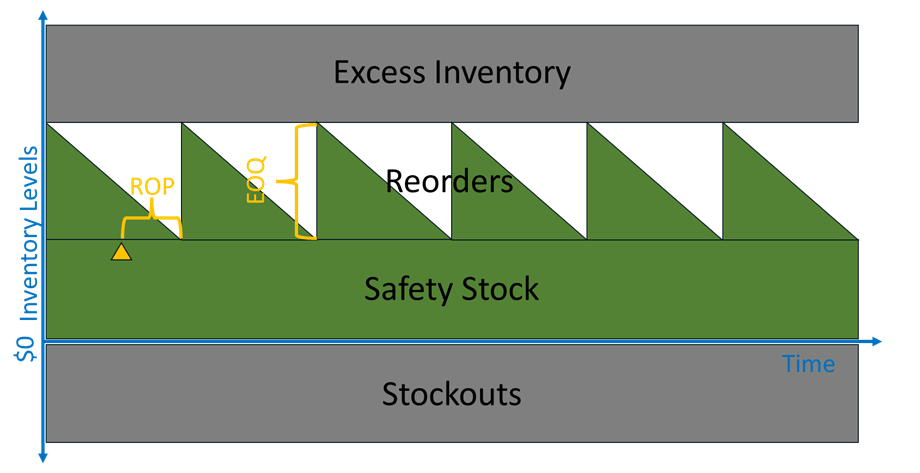
The horizontal axis is time. The vertical axis is the inventory level. You can think of it in dollars or days of inventory. The company has a stockout when there is demand but no inventory. The first layer of inventory that’s consistent for all time periods is the safety stock. In reality, the amount of safety stock may be set to rise and fall with expected sales volumes and sales volatility. The triangles are orders. The order comes in, spiking inventory amounts. It is sold over time, represented by the downward slope of each triangle. A new order spikes inventory amounts again. The size of the order (i.e., the height of the triangle) is set by the economic order quantity formula (EOQ). The timing of the order, represented by the small yellow triangle, is set by the reorder point (ROP) formula. The area at the top of the graph represents excess inventory amounts. Anytime the inventory levels reach these levels, there is too much inventory, which needlessly ties up cash and reduces profits.
Key Factors for Reducing Inventory
I didn’t go through the EOQ and ROP calculations simply to torture you with my fascination with math. The inputs to these formulas identify the ways that we can reduce inventory.
First, we’ll revisit the economic order quantity formula in plain English. It is:
- Two multiplied by the annual demand
- Multiplied by ordering costs
- The product of that is divided by carrying costs,
- We then take the square root of that
Here’s a table that shows the impact on the economic order quantity when the formula inputs are increased:
| Increase in: | EOQ Change |
| Demand | Increase |
| Order Cost | Increase |
| Carrying Costs | Decrease |
An increase in EOQ increases the average inventory balance, which is generally bad from a working capital perspective. We usually want demand to increase, so the increase it causes in inventory is not bad. Decreasing ordering costs allows us to decrease our order sizes and inventory. It also reduces costs to raise profits. Reducing carrying costs improves profits but increases the order sizes. This is not bad because we are holding inventory more efficiently.
Now, let’s look at the reorder point formula. As a reminder, it’s calculated as the average sales per day x lead time in days + safety stock. Here’s a table that shows the impact on the reorder point when the formula inputs are increased:
| Increase in: | ROP Change |
| Sales | Increase |
| Lead Time | Increase |
| Safety Stock | Increase |
An increase in the reorder point increases inventory balances. Increased sales often lead to higher profits, so the related increase in inventory is hopefully a small price we pay for higher profits. Our best way to decrease the ROP is by decreasing the lead time and safety stock.
From a macroeconomic perspective, ROP also shows how uncertainty in supplier delivery times causes all companies to increase lead times and safety stock, which increases inventory levels. That reduces cash flow and profits.
How to Reduce Inventory
We can now dig deeper into how to reduce inventory. We’ve identified the factors that drive inventory balances. What are some ways to improve these factors?
One popular way is through just-in-time (JIT) inventory management. In JIT, production time per batch is reduced through faster setup times and smaller batch sizes. As inventory is consumed in a more efficient production process, smaller amounts of inventory are ordered and received from suppliers. For this to happen, the producer must find suppliers that can cheaply, reliably, and repeatedly deliver the goods. Reliability reduces lead times and the amount of safety stock. Cheap order processing reduces the economic order quantity.
JIT’s focus on efficiency also can reduce holding costs. Smaller inventory sizes and more frequent orders reduce obsolescence and reaction time to market demand changes.
In case you are wondering, I made the following changes to my pencil juggernaut.
- Instead of riding on horseback into the woods to place my order, I now just place it in an online form. This reduced ordering costs from $30 to $20.
- I sold the huge warehouse I owned. I now just keep the pencils in a box under my bed. This decreased holding costs to $10.
- Instead of using toothless people in the United States to make my pencils, they are manufactured by toothless people in another country, who send the pencils to a wholesaler. The wholesaler can get pencils to me in two days, a decrease of 10 days.
- I got over myself and realized that the Journal of Accountancy has never driven pencil sales for me. Also, the improved lead time reliability allows me to reduce my safety stock. The combined improvement allows my safety stock to drop to 100 pencils.
- My economic order quantity is now √((2 X 100 X $20) / $10) = 10 units. This is a decrease (i.e., improvement) of 25 pencils, which is a 70% decrease.
- My reorder point is now 2.74 X 2 + 100 = 105 pencils. This is a decrease (i.e., improvement) of 247 pencils, which is also a 70% decrease.
Of course, real-life improvements are much harder than this, which is why I’ve launched a pencil supply chain management consulting practice with my two American toothless associates.
What About FIFO vs LIFO?
Finally, a creative accountant may point out that using the LIFO (Last-In-First-Out) vs. FIFO (First-In-First-Out) inventory valuation can reduce the inventory balances. This is true from a financial accounting perspective but has no impact on cash flow, and cash flow is reality.
For more info, check out these topics pages: